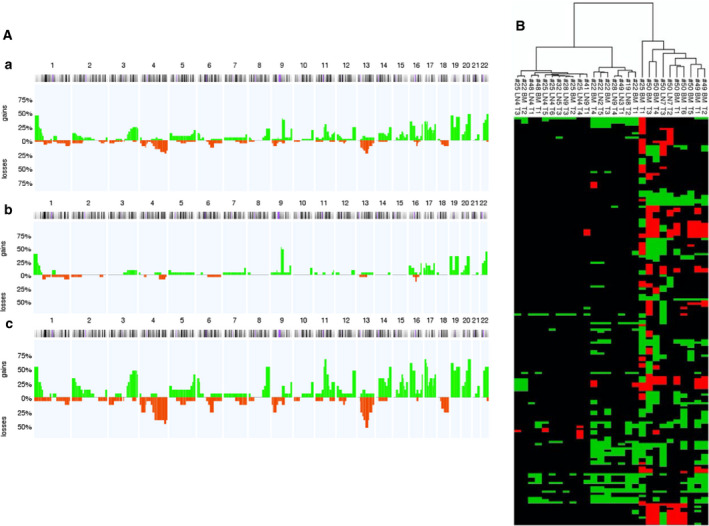
Fig. 3.

(A) Metaphase‐based comparative genomic hybridization (mCGH) analysis of marker‐positive cells showing genomic gains and losses allocated to chromosomes. Cumulative mCGH plot of (a) all analyzed marker‐positive cells from bone marrow (BM) and lymph node (LN) samples, (b) 23 LN‐derived marker‐positive cells, and (c) 15 BM‐derived marker‐positive cells. Horizontal axis = chromosome number, vertical axis = percentage of genomic aberrations, green = amplifications and red = deletions. (B) Dendrogram of similarity analyses of all disseminated tumor cells (DTCs; percentage of aberrant genome (PAG) > 1%) from bone marrow (BM) and lymph nodes (LNs) using r software. In the dendrogram, the chromosomes are in the ascending order on the y‐axis from top to bottom (no visual numbering). The respective DTC is shown on the x‐axis. The dendrogram is on the top of the x‐axis. Green boxes indicate amplifications and red box indicates deletions. The first sample number (#) corresponds to the patient number; LN = LNs with the corresponding numbering; BM = BM with the corresponding numbering T = tumor cell with the corresponding numbering.
