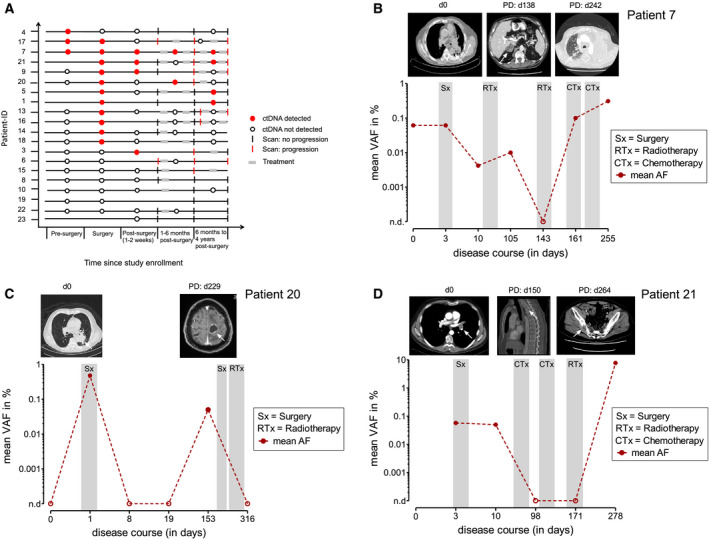
Fig. 4.

ctDNA as biomarker for disease surveillance. (A) Event chart showing the course of the disease with results of radiographic assessment and ctDNA analyses for each patient. Red circle, ctDNA detected; empty circle; ctDNA not detected; black line, imaging studies showing complete response; red lines, imaging studies show detection of disease. (B–D) Change of disease burden in response to treatment and during clinical progression in three different patients. Shown is the mean AF of all monitored SNVs in plasma over serial time points. ctDNA, circulating tumor DNA; Sx, Surgery; RTx, radiotherapy; CTx, chemotherapy; PD, progressive disease; VAF, variant allele frequency.
