
Fig. 1.
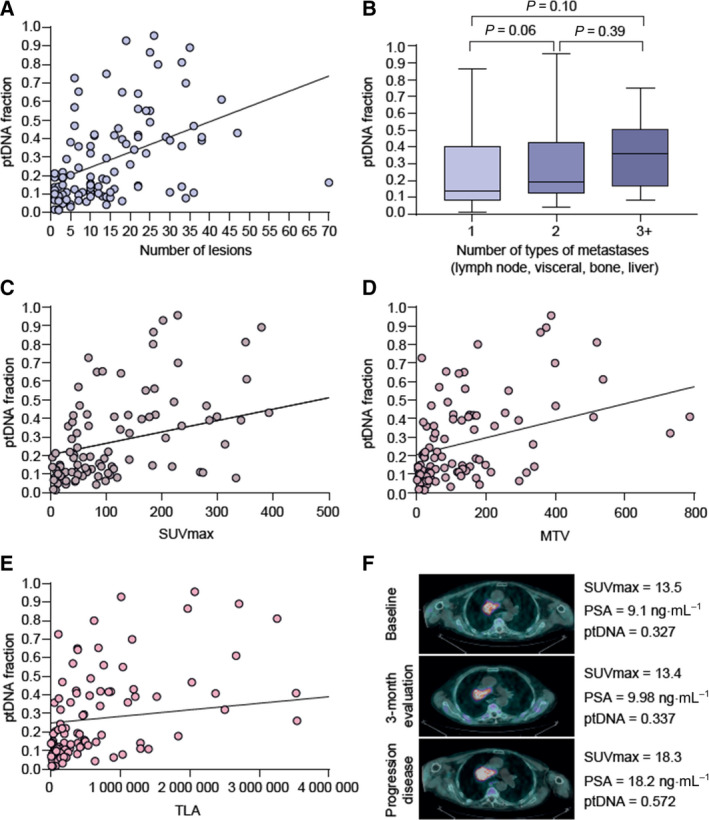
Association of ptDNA fraction with metastatic sites and metabolic activity. (A) Correlation of the number of metastatic sites and ptDNA. The outcome was the relationship between quantitative variables that was examined using the linear correlation coefficient (Pearson product moment correlation coefficient), r = 0.46, P < 0.0001. (B) Association of median ptDNA fraction and the number of types of metastases (66 patients had only one metastatic site, 54 had two metastatic sites, and five had more than two metastatic sites of disease). Box␣plot error bars show the range of the data set. All reasonably ‘extreme’ data are contained between the two ends of the error bars. Error bars are typically extended to be 1.5 times the interquartile range beyond the first and third quartiles if outlier values are present. We used Wilcoxon–Mann–Whitney test for comparison of ptDNA fraction considered as continuous data and number of types of metastases (two independent groups, P = 0.06 and P = 0.39) or Kruskal–Wallis test (three independent groups, P = 0.10). SUVmax (C), MTV (D) and TLA (E) associated with ptDNA fraction. The outcome was the relationship between quantitative variables that was examined using the Pearson linear correlation coefficient: (C) r = 0.48, P < 0.0001; (D) r = 0.47, P < 0.0001; (E) r = 0.37, P < 0.0001. (F) Representative case of association of metabolic activity and ptDNA fraction. MTV, metabolic tumour activity; TLA, tumour lesion activity.