
Fig. 3.
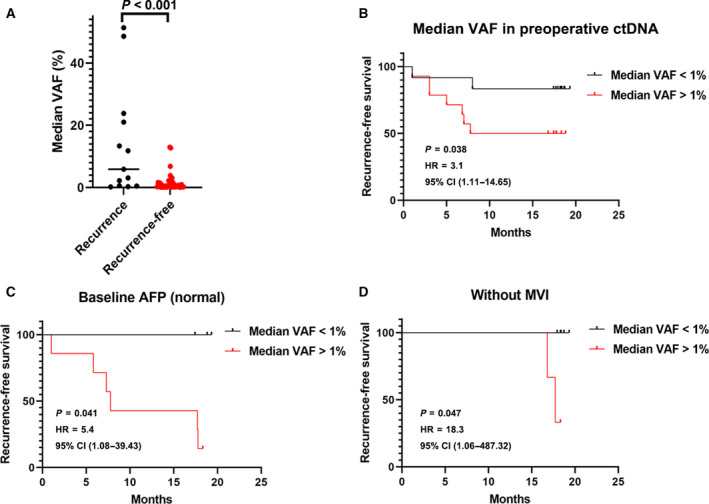
Associations between mutational median VAF of baseline ctDNA with tumor recurrence and clinical parameters. (A) The median VAF distribution of preoperative ctDNA in patients with different recurrence status (n = 13 for the recurrence group and n = 28 for the recurrence‐free group). Test for comparison of two groups is done by the Wilcoxon test. (B) The Kaplan–Meier analysis of median VAF of preoperative ctDNA (n = 12 for median VAF< 1% group and n = 13 for median VAF > 1% group). (C) The Kaplan–Meier analysis of median VAF of preoperative ctDNA in patients with normal baseline AFP levels (n = 7 for median VAF < 1% group and n = 7 for median VAF > 1% group). (D) The Kaplan–Meier analysis of median VAF of preoperative ctDNA in patients with no MVI (n = 5 for median VAF < 1% group and n = 5 for median VAF > 1% group). VAF at 1% cutoff threshold; RFS was estimated using the Kaplan–Meier method, described with median and 95% CI, and compared using the log‐rank test.