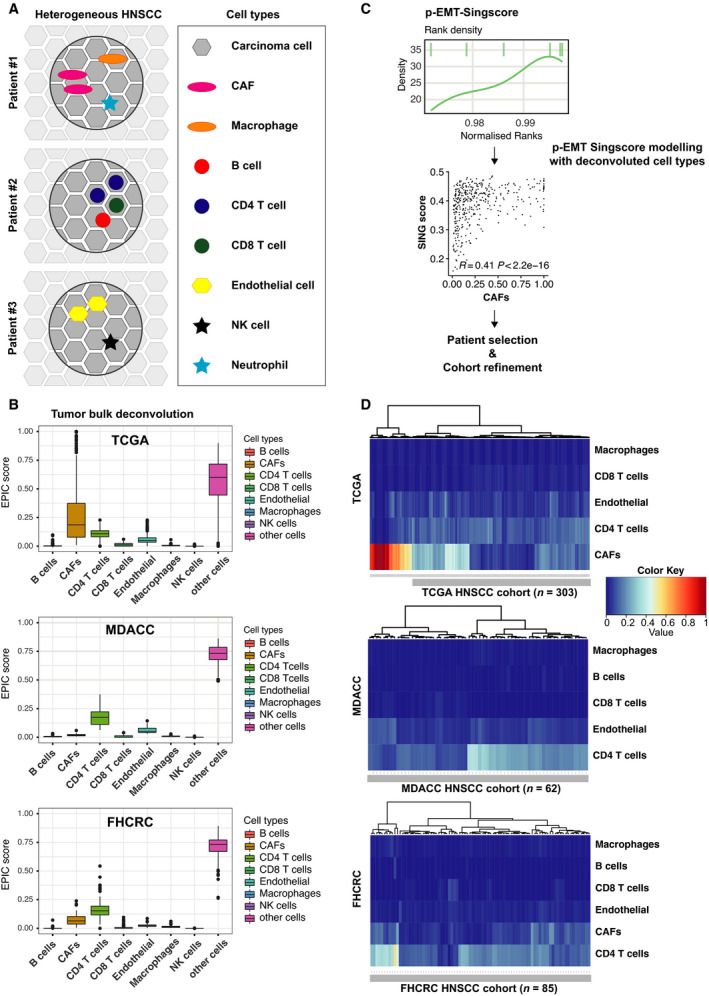
Fig. 1.

Generation of pEMT‐Singscores. (A) Schematic representation of cellular heterogeneity in HNSCC including nonmalignant cell types. (B) Bulk RNA‐seq deconvolution using the EPIC algorithm. Shown are proportions of the indicated cell types in TCGA, MDACC, and FHCRC. (C) Schematic representation of pEMT‐Singscore generation, stepwise feature selection, and determination of nonmalignant cell types modeling pEMT for patient selection and cohort refinement. (D) Heatmap with hierarchical clustering of Euclidean distance matrix of patients of the TCGA, MDACC, and FHCRC cohorts for the indicated cell types implemented in the modeling of pEMT‐Singscores. Refined cohorts lacking patients with high CAF content in TCGA are marked with a gray bar and patient numbers are indicated.
