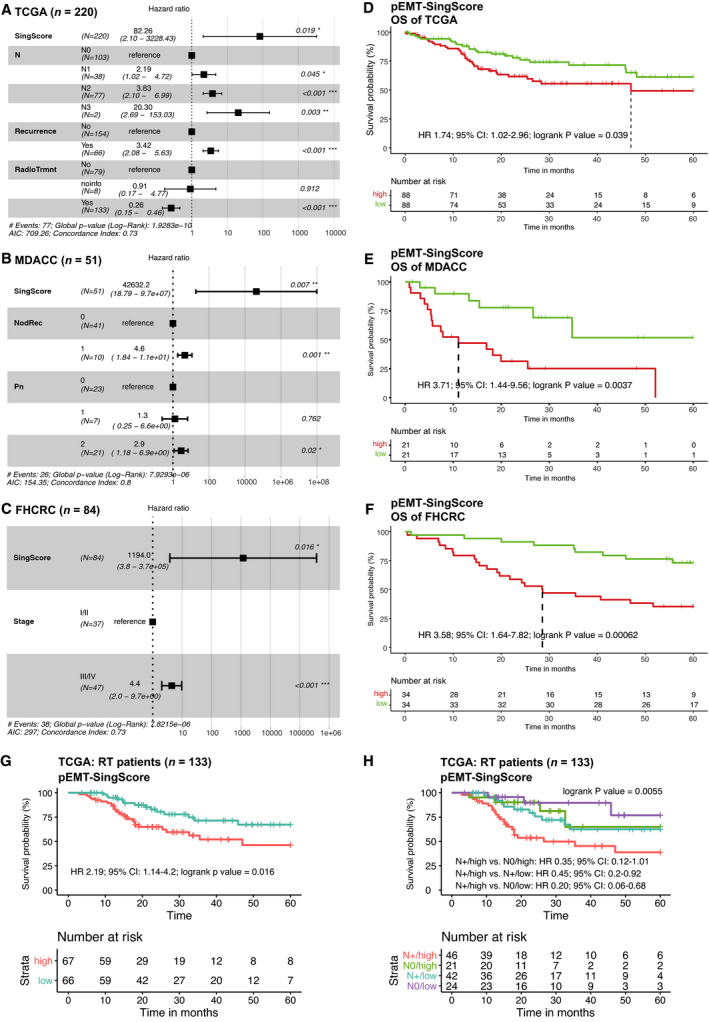
Fig. 2.

pEMT‐Singscore is a molecular prognosticator of OS in HNSCC. (A–C) pEMT‐Singscores were calculated for n = 15 common pEMT genes for patients in the TCGA (A), MDACC (B), and FHCRC (C) cohorts and served to compute a multivariable CoxPH model. Shown are Forest plots including all univariables significantly associated with OS in multivariable CoxPH models with patient numbers, linear hazard ratios, 95% CI, logrank P‐values, AIC, and concordance indexes. (D–F) Kaplan–Meier curves stratified after pEMT‐Singscores with CoxPH ratio (HR), 95% confidence intervals (CI), logrank P‐values, and survival table is shown. pEMT‐Singscorehigh: upper 40%; pEMT‐Singscorelow: lower 40%. (G, H) Kaplan–Meier curve stratified after median pEMT‐Singscores with CoxPH ratio (HR), 95% confidence intervals (CI), logrank P‐values, and survival table is shown for n = 133 patients of the TCGA cohort who received therapeutic irradiation. In (H), patients are further stratified according to the presence and absence of nodal metastases (N+/N0).
