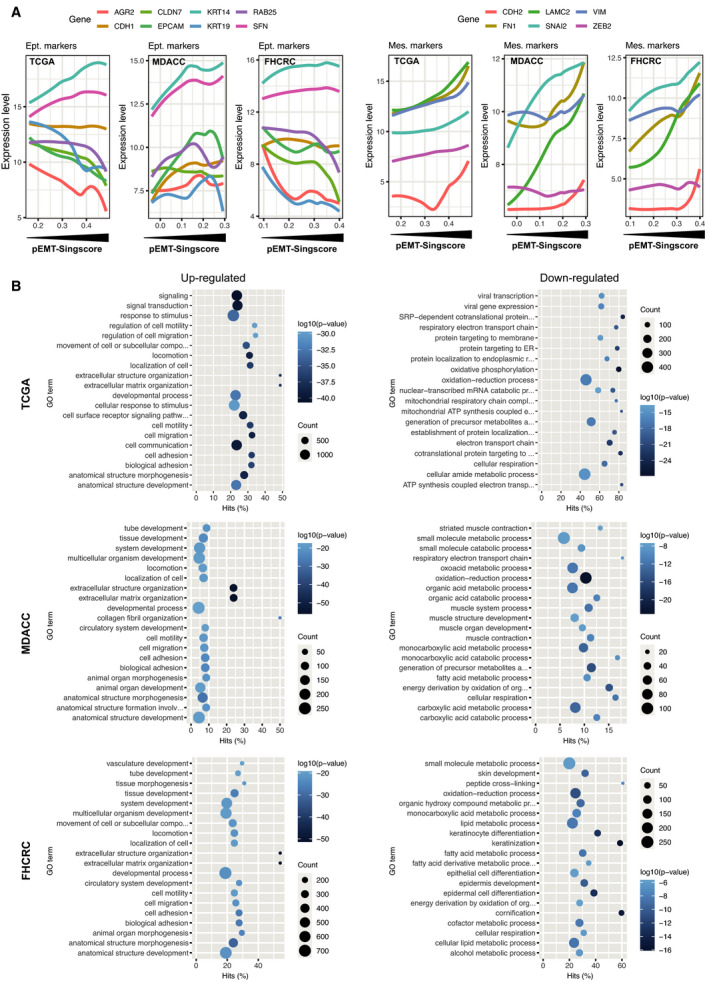
Fig. 3.

Gene expression profiles in pEMT (A) Expression levels of epithelial (E‐cadherin, claudin 7, keratin 14 and 19, Rab25, EpCAM, anterior gradient 2, stratifin 1) and mesenchymal markers (fibronectin 1, vimentin, N‐cadherin, laminin C2), and the EMT‐TFs SLUG and Zeb2 in the TCGA, MDACC, and FHCRC cohorts were plotted with line smoothing using loess against pEMT‐Singscores. (B) DEGs were identified using DESeq, edgeR, and limma‐voom algorithms comparing pEMT‐Singscorehigh and pEMT‐Singscorelow patients in the TCGA, MDACC, and FHCRC cohorts. GSEA of GO terms biological process was conducted and the top n = 20 (log10 P‐value) up‐ and down‐regulated GO terms are depicted including gene counts.
