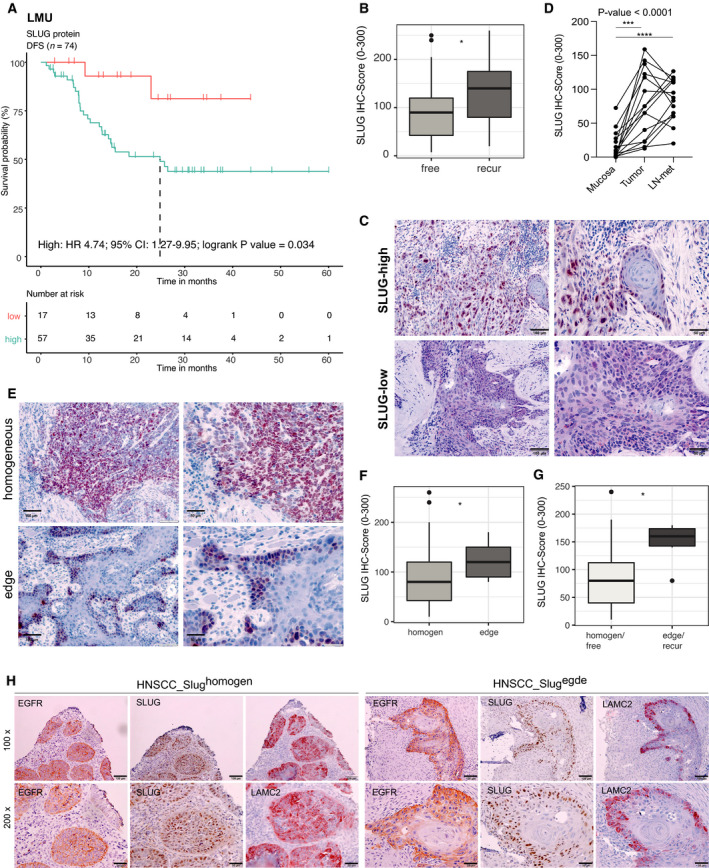
Fig. 6.

SLUG protein level is prognostic and associated with tumor progression. (A) Multivariable CoxPH was modeled for patients of the LMU cohort of HPV‐negative HNSCC patients (n = 74). Kaplan–Meier survival curve and table with logrank P‐value, Cox HR, and 95% CI after stratification according to SLUG IHC score [1st quartile (low) vs. 2nd–4th quartiles (high)] are shown. (B) Box plots show respective SLUG IHC score of patients suffering from recurrence vs. recurrence‐free. Wilcoxon test is shown. *P‐value ≤ 0.05. (C) Representative examples of high and low nuclear IHC SLUG staining intensity in primary tumors from n = 15 matched triplets of normal mucosa, primary tumors, and lymph node metastases. Scale bars represent 100 µm (left panels) and 50 µm (right panels). (D) Line plots of nuclear SLUG IHC score in tumor‐free mucosa, tumor, and lymph node metastases from n = 15 HNSCC patients. One‐way ANOVA post hoc Tukey HSD is shown with overall P‐value. Adjusted P‐values of multiple tests: ***P‐value = 0.0003, ****P‐value < 0.0001. (E) Representative examples of homogeneous or edge SLUG staining in primary tumors from n = 15 matched triplets of normal mucosa, primary tumors, and lymph node metastases. Scale bars represent 100 µm (left panels) and 50 µm (right panels). (F) Box plots of SLUG IHC scores according to protein localization (homogen., homogeneous or edge). Wilcoxon test is shown. *P‐value ≤ 0.05. (G) Box plots of SLUG IHC scores in patients of the LMU cohort showing a homogeneous SLUG expression and no recurrence vs. a SLUG expression at the periphery (edge) and recurrences. Wilcoxon test is shown. *P‐value ≤ 0.05. (H) Representative examples of EGFR, SLUG, and LAMC2 expression in HNSCC with homogeneous (left panels; n = 5 tumors) and edge expression of SLUG (right panels; n = 5 tumors) in 100× and 200× magnifications. Scale bars represent 100 µm.
