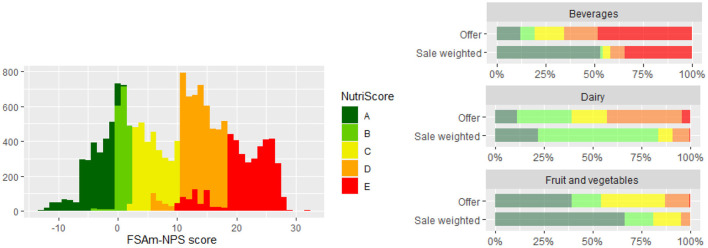
Figure 5.
(Left): Distribution of Food Standards Agency Nutrient Profile (FSAm-NPS) scores and corresponding Nutri-Score grades for foods and drinks in the Slovenian food supply. (Right): Distribution of Nutri-Score grades across selected categories using sale-weighting. Reproduced from Hafner et al. (60) with approval of authors.

