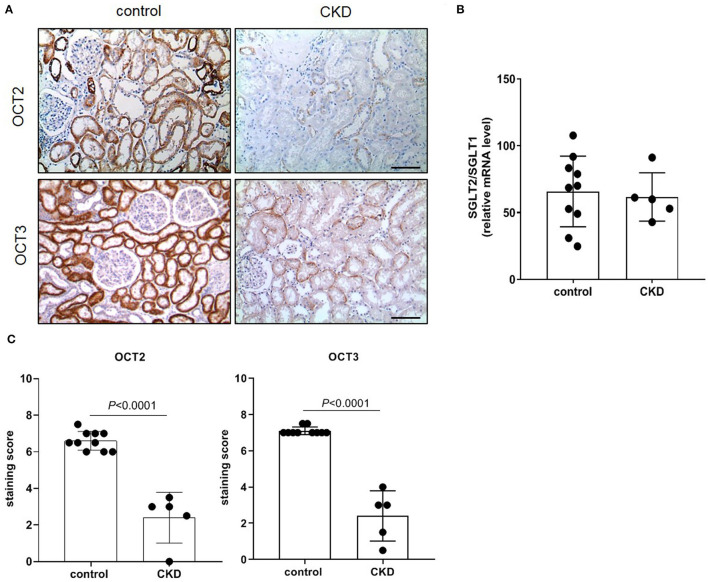
Figure 1.
Immunostaining of human OCT2 and OCT3. Kidney biopsies were obtained from patients diagnosed with chronic kidney disease (CKD). Normal tissue available from partial nephrectomy in patients diagnosed with renal cancer were used as control. Representative images of immunostaining for OCT2 and OCT3 (A). Scale bar = 50 μm. The ratio of SGLT2/SGLT1 mRNA level was used as control of the site of the biopsy. Data were normalized for the expression level of β-actin, used as housekeeping gene, and expressed as mean ± SD (B). Relative quantification of the OCT2 and OCT3 staining per high-power field (C). All comparisons were performed by unpaired Student t-test. In scatter plot representation, each dot represents one individual sample.

