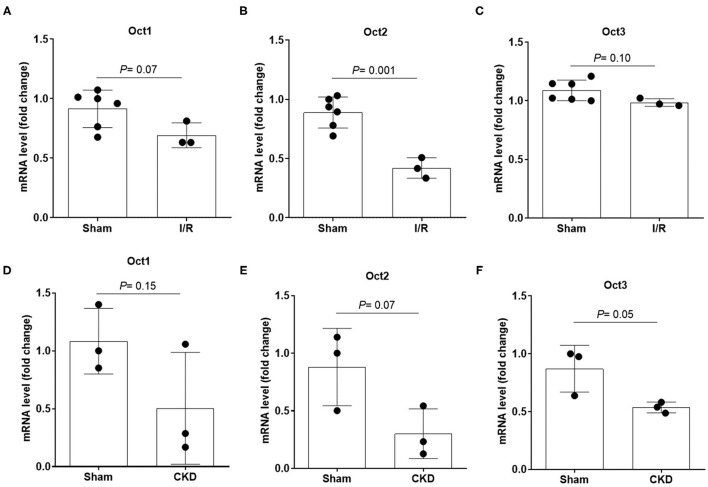
Figure 2.
mRNA expression level of Oct1, Oct2 and Oct3 in rat kidney. Relative quantification of mRNA levels of Oct1, Oct2 and Oct3 in kidney of rats that underwent 5/6 nephrectomy to induce CKD (A–C) or unilateral with contralateral nephrectomy to induce AKI (D–F). Data were normalized for the expression level of β-actin, used as housekeeping gene, and expressed as mean ± SD relative to sham values. All comparisons were performed by unpaired Student t-test. In scatter plot representation, each dot represents one individual sample.

