Figure 4.
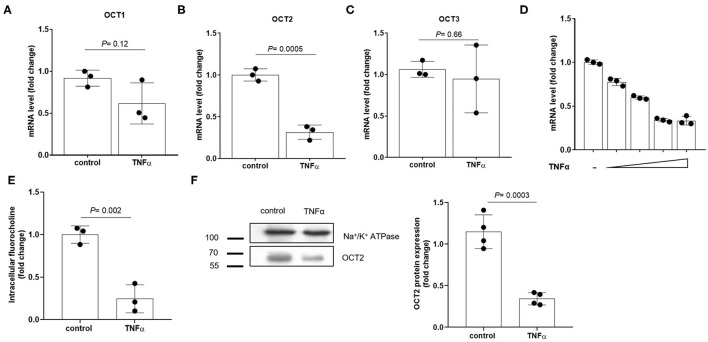
Expression of OCTs in RPTEC cells exposed to TNFα. Relative quantification of mRNA levels of OCT1 (A), OCT2 (B) and OCT3 (C) in RPTEC cells exposed for 24 h to recombinant TNFα at the extracellular concentration of 10 ng/ml. mRNA expression level of OCT2 in RPTEC cells exposed for 24 h to increasing extracellular concentrations of recombinant TNFα (2, 5, 10, 20 ng/ml) (D). All mRNA data were normalized for the expression level of β-actin and expressed as mean ± SD relative to the control values. Uptake of fluorocholine, an OCT substrate, in RPTEC cells exposed for 72 h to recombinant TNFα at the extracellular concentration of 10 ng/ml (E). Representative western blotting and quantification relative to the expression of the Na+/K+ ATPase of OCT2 from the total lysate of RPTEC cells exposed for 72 h to recombinant TNFα at the extracellular concentration of 10 ng/ml (F). In scatter plot representation, each dot represents one biological replicate.

