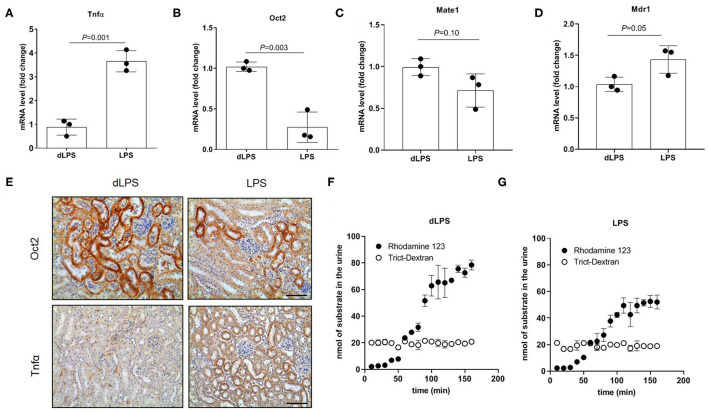
Figure 7.
Tubular secretion in rats treated with lipopolysaccharide (LPS). Relative quantification of mRNA (A–D) and representative immunostaining of protein expression level (E) in kidneys of rats injected with LPS. Animal controls were injected with the same amount of detoxified LPS (dLPS). Scale bar = 50 μm. mRNA data were normalized for the expression level of β-actin and expressed as mean ± SD relative to the dLPS values. Urinary excretion over time of Rhodamine 123 and Trict-Dextran in rats (n = 2) (F,G). All comparisons were performed by unpaired Student t-test. In scatter plot representation, each dot represents one individual sample.

