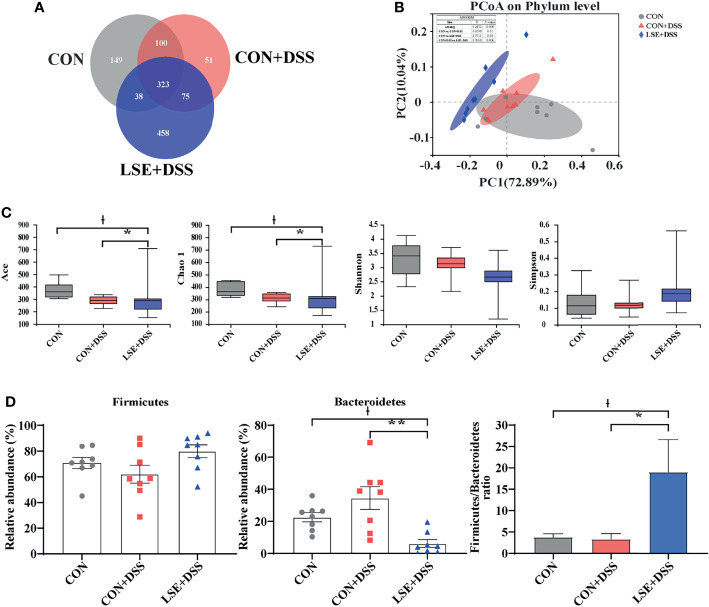
Figure 5.
Effects of LSE administration on intestinal microbiota inflammatory in DSS-induced colitis mice. (A) A Venn diagram showing the overlap of the OTUs identified in the intestinal microbiota among the three groups. (B) PCoA plot of the gut microbiota based on weighted UniFrac distance. (C) The α-diversity of each group. (D) The abundance of Firmicutes and Bacteroidetes and Firmicutes/Bacteroidetes ratio at phylum levels. Data are presented as mean ± SEM, n = 8. * P < 0.05 and ** P < 0.01 vs. the CON+DSS group, †P < 0.05 vs. the CON group.

