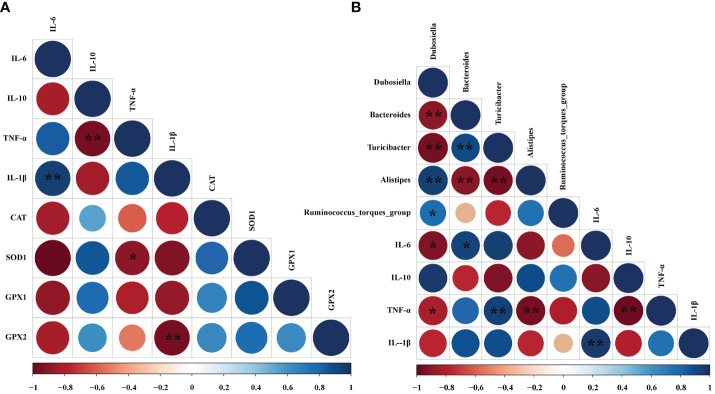
Figure 8.
Correlation analysis between oxidative indexes, microorganisms, and inflammatory cell cytokines in DSS-induced colitis mice. (A) Correlation analyses between the oxidative indexes and colon mRNA expression of inflammatory cytokines. (B) Correlation analyses between the colonic microbiota and colon mRNA expression of inflammatory cytokines. The color of the circles demonstrated the level of the correlation index, and the size of the circles represents the strength of correlation (large size = stronger correlation). The * P < 0.05 and ** P < 0.01 represents correlation with each other.

