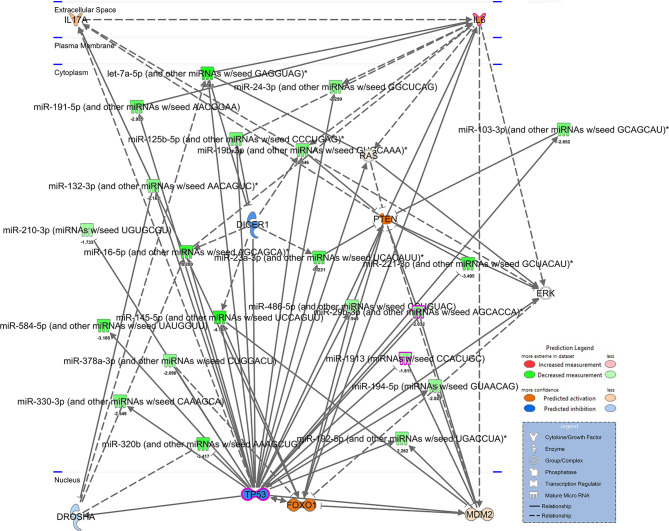
Figure 2.
Network of TP53 interactions with dysregulated miRNA from PTSD patients. IPA-derived network depicting dysregulated miRNA associated with TP53 from mean fold changes of Control (n=4) vs. PTSD (n=8) PMBCs. miRNA are depicted in green to denote downregulation (darker green denotes more downregulation) or red to denote decreased expression. Genes depicted in the network are predicted to be activated (orange) or inhibited (blue) based on interactions present, as noted in the Prediction Legend. A separate legend (lower right corner) is provided to identify components depicted in the network. Solid lines indicate direct interactions, and doted lines indicate either indirect or highly-predicted interactions.

