Figure 3.
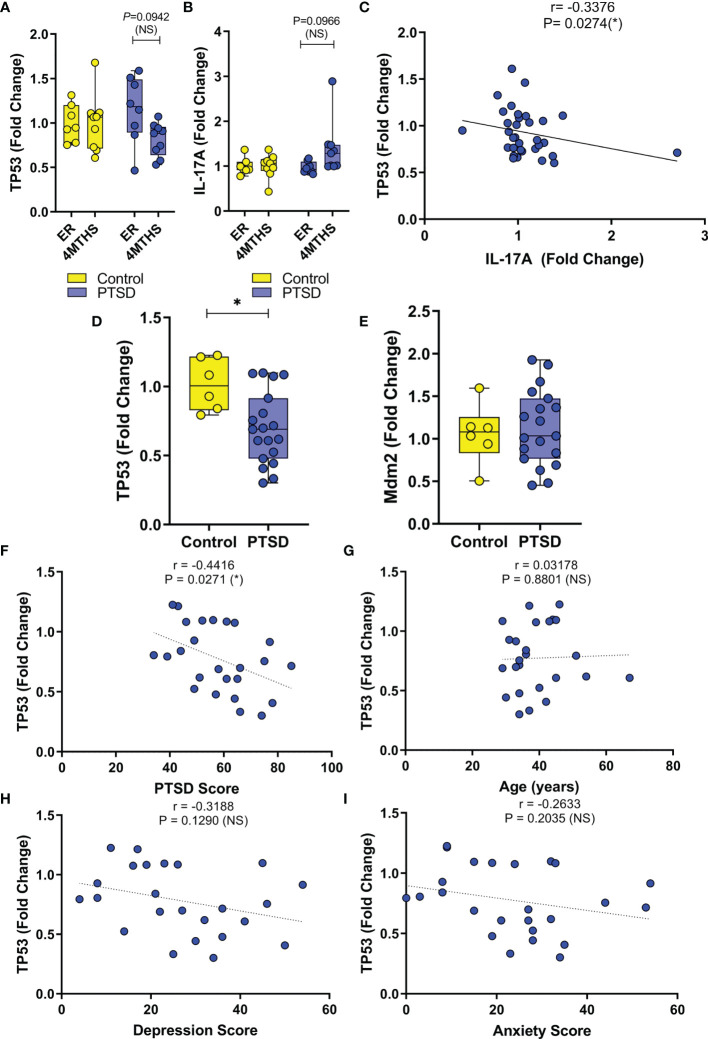
Expression of TP53 in PBMCs is downregulated in PTSD samples compared to Control. (A–C) Normalized expression data was analyzed from public database (ID. GSE860) between PTSD (n=17) and Controls (n=15), with two time points during initial emergency room visit for trauma (ER) and 4 months later (4MTHS). (A) Box and whisker plot depicting fold change expression of TP53. (B) Box and whisker plot depicting fold change expression of IL-17A. (C) Correlation plot between TP53 and IL-17A fold change expression. (D–I) PBMC gene expression data was collected from VMC PTSD (n=19) and Control volunteers (n=6). (D) Box and whisker plot depicting TP53 expression by PCR. (E) Box and whisker plot depicting Mdm2 expression by PCR. Correlation plots depicting (F) TP53 vs. PTSD score, (G) TP53 vs age of cohort, (H) TP53 vs. Depression score, and (I) TP53 vs. Anxiety score. Box and whisker bars depict maximum and minimum values, with middle bar depicted at the median. For box and whisker plots, significance was determined using an unpaired standard t test. For correlation plots, Pearson correlation test was used to determine significance. Significance was defined as having p-value ≤ 0.05 (*).

