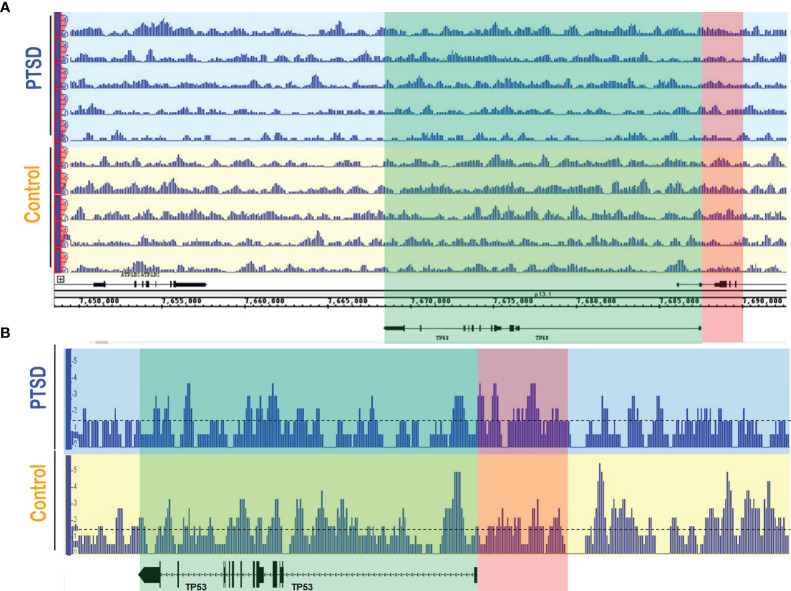
Figure 4.
PTSD PBMCs had increased DNA methylation in TP53 promoter region. MeDIP-seq was performed on randomly selected PTSD (n=5) and Control (n=5) PBMC samples. Visualization of the methylated genome was acquired in the IGB genome browser (www.bioviz.org) for (A) individual samples, and (B) combined samples within respective groups. Blue sections indicate PTSD samples, and yellow sections represent Controls. Green section indicates the TP53 gene, while the red section represents one of the known TP53 promoter regions (~5kb) provided in the Ensembl genome browser (www.ensembl.org). For combined data, a line at 1.5 value was drawn to better visualize methylation intensity between the two groups. Differences observed are qualitative measures in which increased signal intensity (e.g. peak height and width) signify more DNA methylation. Signal intensity in the PTSD group was greater overall in the TP53 promoter compared to Control samples.

