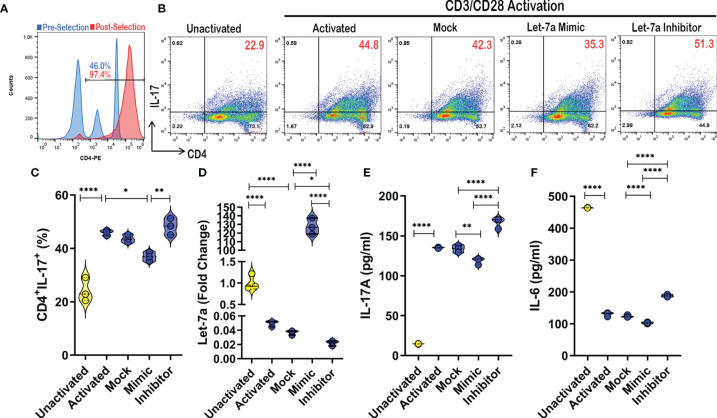
Figure 5.
Let-7a modulation affects Th17 development and function. (A) CD4+ cells were purified using magnetic bead separation from PBMCs provided by healthy control donor, which was validated using flow cytometry to ensure purity (>95%). (B) Representative flow cytometry plots depicting Th17 cells (CD4+IL-17A+) in unactivated or CD3/CD28 activation cultures (24 hours) in the absence or presence of mock, let-7a mimic, or let-7a inhibitor. Red numbers indicating double positive TH17 percentage. (C) Violin plot depicting Th17 percentages as assessed by flow cytometry. (D) Violin plot depicting expression of let-7a as assessed by PCR. (E) Violin plot depicting IL-17 concentration as assessed by ELISA from cell culture supernatants. (F) Violin plot depicting IL-6 concentration as assessed by ELISA from cell culture supernatants. In vitro data are representative of at least 3 independent experiments, with 3 samples per culture condition. One way ANOVA was used to determine significance between groups. Significance was determined as p-value ≤ 0.05(*), ≤ 0.01(**), ≤ 0.001(****).

