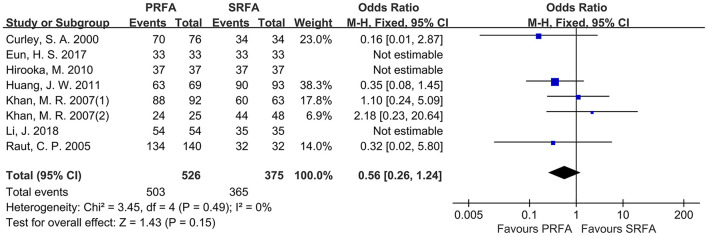
Figure 2.
Forest plots for complete ablation rate. Forest plot for complete ablation rate indicates no significantly between the PRFA group as compared with that in the SRFA group (95.63% and 97.33%, respectively; OR, 0.56; 95%CI, 0.26-1.24; p = 0.15), and no statistical heterogeneity was found (χ2 = 3.45; p = 0.49, I2 = 0%).

