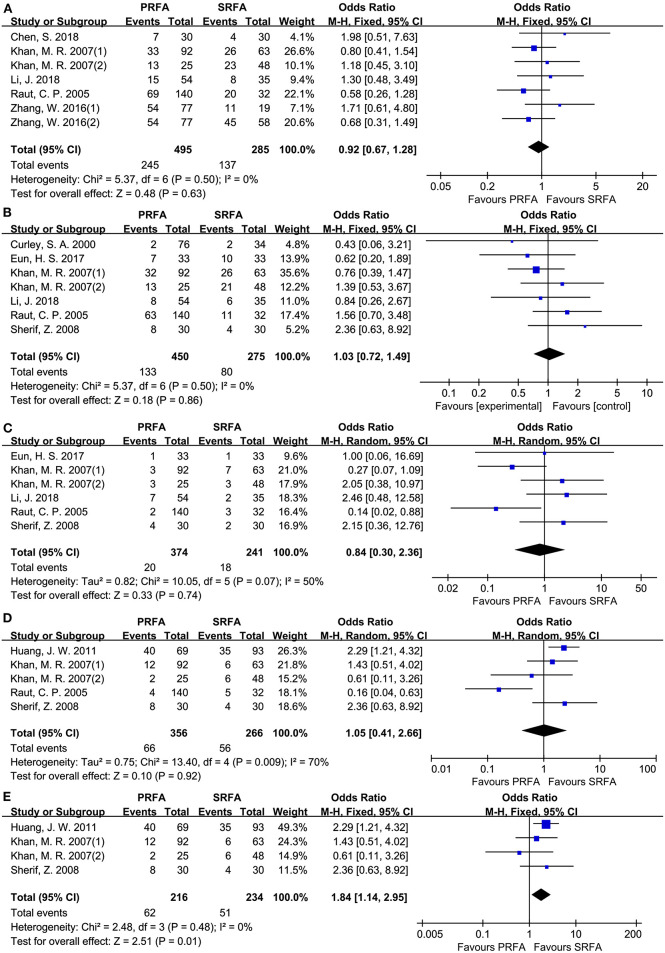
Figure 3.
Forest plot for tumor recurrence. (A) Forest plot for total recurrence indicates no significantly between the PRFA group and the SRFA group (49.49% and 48.07%, respectively; OR, 0.92; 95% CI, 0.67-1.28; p = 0.63). (B) Forest plot for intrahepatic recurrence indicates no significantly between PRFA and SRFA (29.56% and 29.09%, respectively; OR, 1.03; 95% CI, 0.72-1.49; p = 0.86). (C) Forest plot for extrahepatic metastasis indicates no significantly between PRFA and SRFA (5.35% and 7.47%, respectively; OR, 0.84; 95% CI, 0.30-2.36; p = 0.61). (D) Forest plot for local recurrence indicates no significantly between PRFA and SRFA (18.54% and 21.05%, respectively; OR, 1.05; 95% CI, 0.41-2.66; p = 0.92; χ2 = 13.4; p = 0.009, I2 = 70%). (E) Forest plot for sensitivity analysis of local recurrence indicates less recurrent in the SRFA group (28.7% and 21.79%, respectively; OR, 1.84; 95% CI, 1.14-2.95; p = 0.01; χ2 = 2.48; p = 0.48, I2 = 0%).

