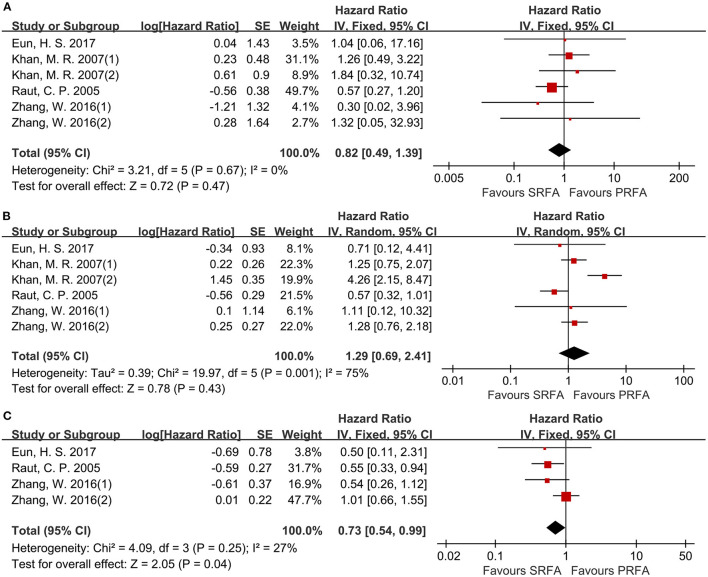
Figure 7.
Forest plot for DFS. (A) Forest plot for 1-year DFS indicates no significantly between the PRFA group and the SRFA group (HR, 0.82; 95% CI: 0.49–1.39). (B) Forest plot for 3-year DFS indicates no significantly between the PRFA group and the SRFA group (HR, 1.29; 95% CI: 0.69–2.41). (C) Forest plot for 5-year DFS indicates the PRFA group was significantly lower than the SRFA group (HR, 0.73; 95% CI: 0.54–0.99).

