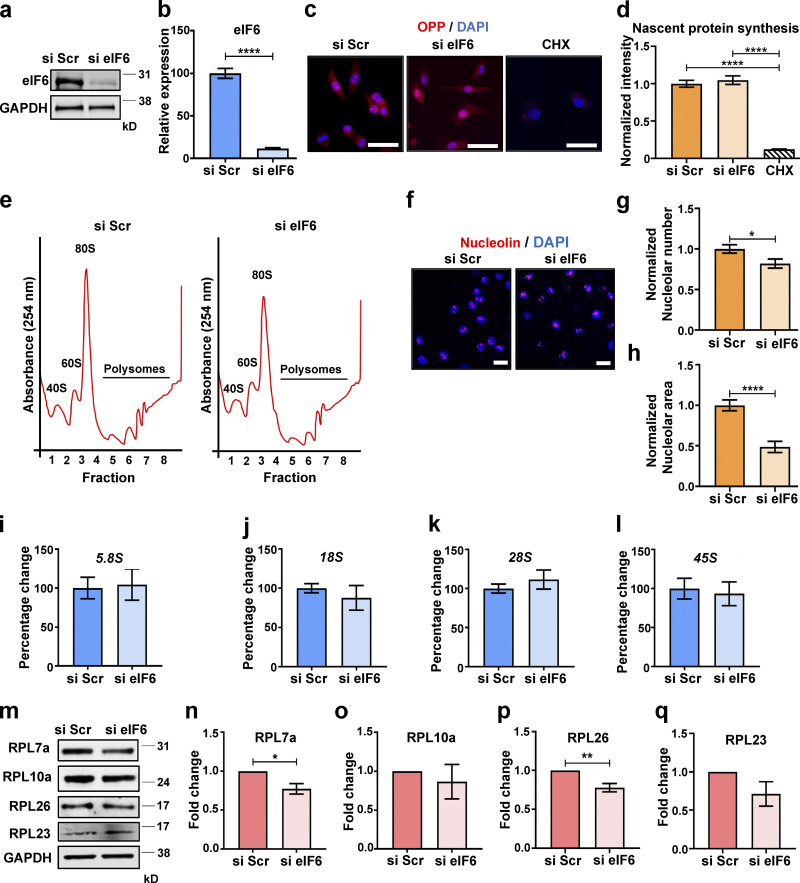
Figure 1.
Depletion of endogenous eIF6 does not affect basal levels of protein synthesis or ribosome biogenesis. (a and b) Representative Western blot of si Scr– or si eIF6–transfected ECs and quantification of knockdown efficiency (n = 4). (c) Representative fluorescent micrographs of si Scr– or si eIF6–transfected ECs, or cycloheximide (CHX)-treated ECs following incorporation of OPP to label nascent proteins (red) using a Click-iT assay and costaining of cell nuclei (DAPI; blue). Scale bars = 20 μm. (d) Quantification of cell fluorescence following OPP incorporation Click-iT assay (n > 30 cells across three separate experiments). (e) Representative polysome profiles from si Scr and si eIF6 A431 cells after sucrose gradient fractionation, showing the small ribosomal subunit (40S), the large ribosomal subunit (60S), and the monoribosome (80S; n = 3). (f) Representative immunofluorescent micrographs of si Scr and si eIF6 ECs showing nucleolin (red) and cell nuclei (DAPI; blue). Scale bars = 20 μm. (g and h) Quantification of nucleolar frequency per cell (g) and nucleolar area (h; n > 30 and n > 60, respectively, across three separate experiments). (i–l) Quantification of pre-rRNA by qPCR in si Scr– and si eIF6–transfected ECs relative to GAPDH (n > 3): 5.8S rRNA (i), 18S rRNA (j), 28S rRNA (k), and 45S rRNA (l). (m–q) Quantification of ribosomal protein expression in si Scr– and si eIF6–transfected ECs, representative Western blots (m) and band intensity quantification of RPL7a (n), RPL10a (o), RPL26 (p), and RPL23 (q; n > 3). Values in b, d, g–l, and n–q are mean ± SEM, and significance was determined by two-sided t test. *, P < 0.05; **, P < 0.01; ****, P < 0.0001. Source data are available for this figure: SourceData F1.

