Figure S1.
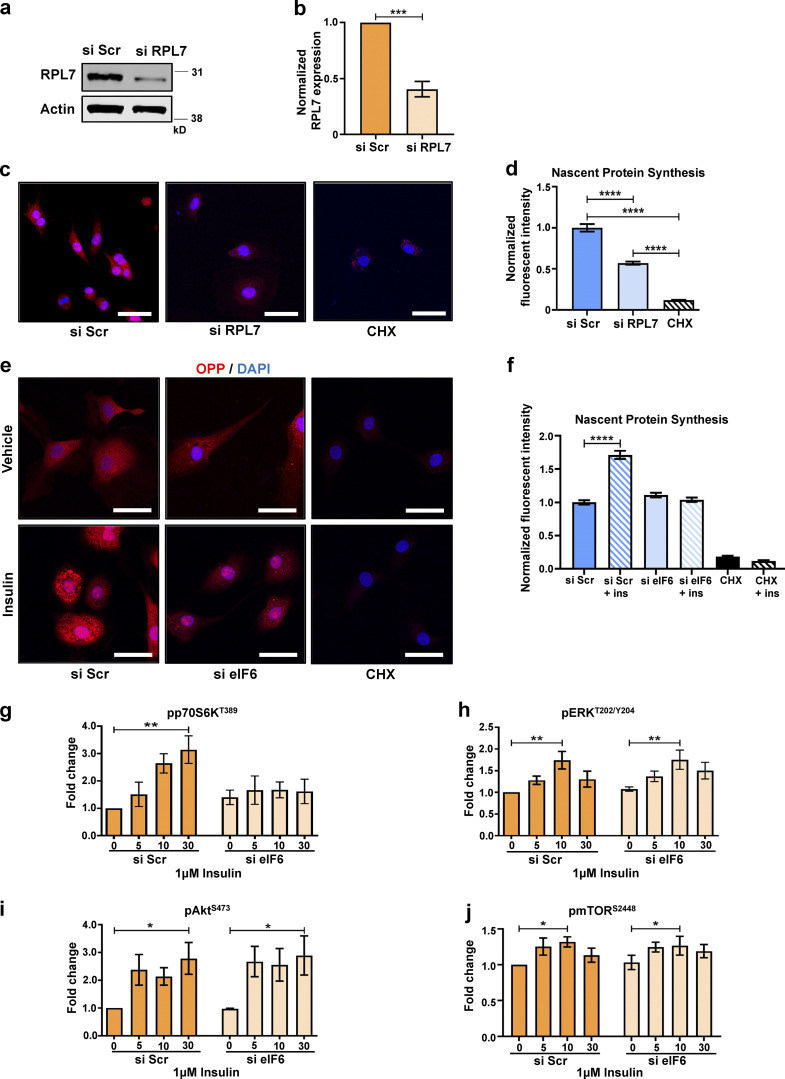
Contribution of eIF6 and ribosomal proteins to nascent protein synthesis. Cells were transfected with si Scr or si RPL7. (a and b) Representative Western blot (a) and mean quantification (b) of siRNA knockdown of RPL7 (n = 3). (c–f) OPP was incorporated into cells to label nascent proteins (red) using a Click-iT assay, and cell nuclei were costained with DAPI (blue). Cycloheximide (CHX) was used as a negative control for OPP incorporation. (c) Representative fluorescent micrographs of si Scr– or si RPL7–transfected ECs or CHX-treated ECs. Scale bars = 20 μm. (d) Quantification of cell fluorescence following OPP incorporation Click-iT assay in c (n > 30 cells across three separate experiments). (e) Representative fluorescent micrographs of si Scr– or si eIF6–transfected ECs or CHX-treated ECs, ±30-min insulin stimulation. Scale bars = 20 μm. (f) Quantification of cell fluorescence following OPP incorporation Click-iT assay in e (n > 30 cells across three separate experiments). (g–j) Quantification of phosphorylated p70S6K (pp70S6KT389) relative to p70S6K (g), pERKT202/Y204 relative to ERK (h), pAktS473 relative to Akt (i), and pmTORS2448 relative to mTOR (j) in response to 1 μM insulin (for 0, 5, 10, or 30 min) in si Scr or si eIF6 A431 cells (n = 3). Values in b, d, and f–j are mean ± SEM, and significance in b was determined by two-sided t test and in d and f–j by two-way ANOVA. *, P < 0.05; **, P < 0.01; ***, P < 0.001; ****, P < 0.0001. ins, insulin. Source data are available for this figure: SourceData FS1.

