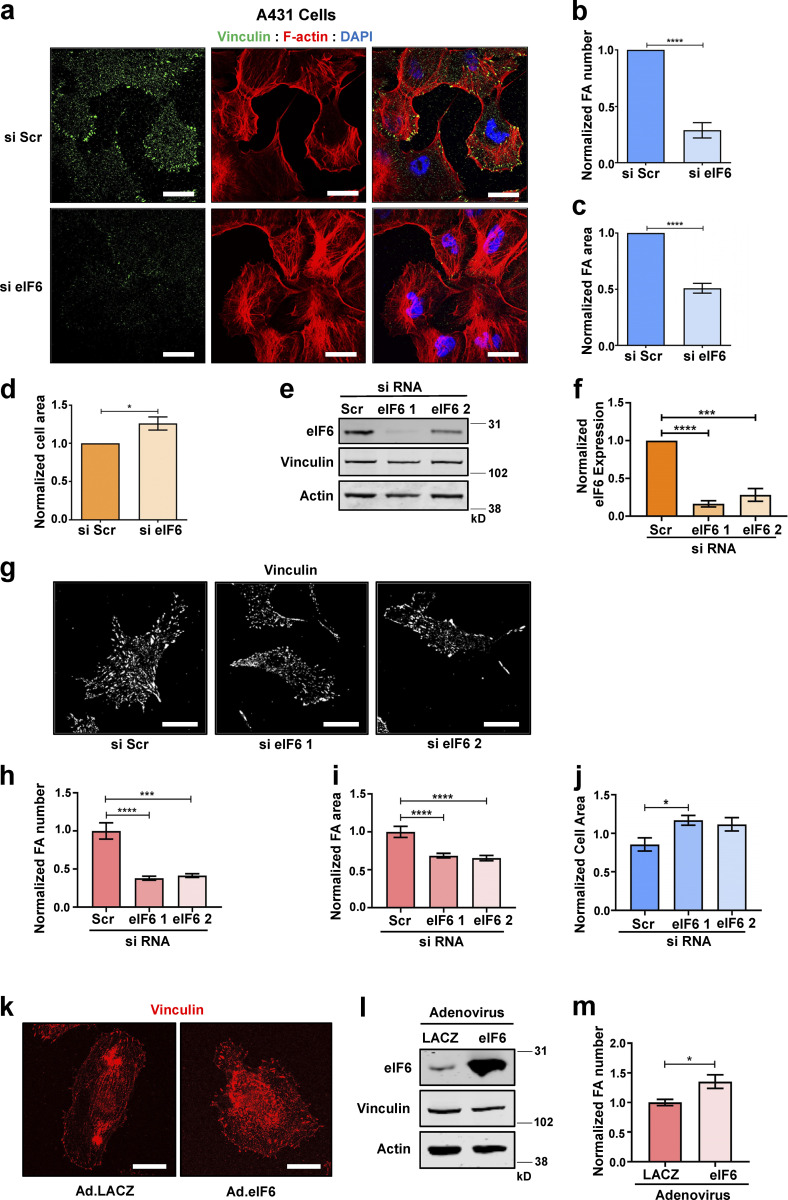
Figure S2.
eIF6 regulates focal adhesions. (a–d) A431 cells were transfected with si Scr or si eIF6. (a) Representative immunofluorescent micrographs of cells showing focal adhesions (vinculin; green), filamentous actin (phalloidin; red), and nuclei (DAPI; blue). Scale bars = 20 μm. (b and c) Quantification of mean frequency of focal adhesions per cell (b) and focal adhesion area (c; n > 30 cells across three separate experiments). (d) Quantification of cell area (n > 30 cells across three separate experiments). (e–j) ECs were transfected with si Scr or one of two individual eIF6 siRNAs (si eIF6 1 and si eIF6 2). (e and f) Representative Western blot for eIF6 protein levels (e) and quantification of Western blot band intensities (f; n = 3). (g) Representative immunofluorescent micrographs showing vinculin-positive focal adhesions (white) in si Scr, si eIF6 1, and si eIF6 2 cells. Scale bars = 20 μm. (h and i) Quantification of mean frequency per cell (h) and mean area (i) of vinculin-positive focal adhesions (n >30 cells across three separate experiments). (j) Quantification of mean cell area (n > 30 cells across three separate experiments). (k–m) ECs were transduced with control adenovirus (Ad.LACZ) or an eIF6-expressing adenovirus (Ad.eIF6). (k) Representative immunofluorescent micrographs showing vinculin-positive focal adhesions (red). Scale bars = 20 μm. (l) Representative Western blot for eIF6 protein level (n = 5). (m) Quantification of mean frequency of vinculin-positive focal adhesions per cell (n > 30 cells across three separate experiments). Values in b–d, f, h–j, and m are mean ± SEM, and significance was determined by two-way t test; *, P < 0.05; ***, P < 0.001; ****, P < 0.0001. FA, focal adhesion. Source data are available for this figure: SourceData FS2.

