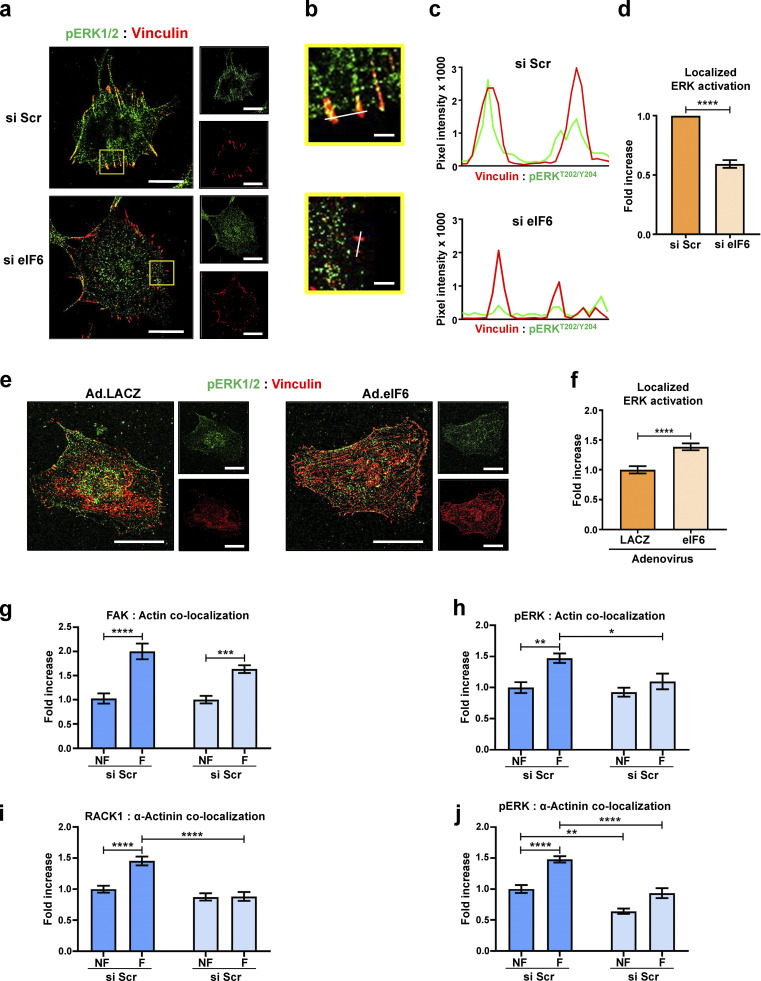
Figure S5.
eIF6 regulates localization of activated ERK1/2 and mechanocomplex formation at focal adhesions. (a–d) Depletion of eIF6 disrupts localization of activated ERK1/2 in migrating cells. (a) Representative immunofluorescent confocal micrographs for si Scr– and si eIF6–transfected ECs showing pERK1/2T202/Y204 (green) and vinculin (red). Scale bars = 20 μm. (b) Higher magnification images of selected region in a. Scale bars = 2 μm. (c) Representative fluorescent intensities along the white line indicated in the merged image shown in b were quantified using line scan mode. Line scans are plotted in the graph shown. (d) Colocalization of pERK1/2T202/Y204 to vinculin was quantified using Pearson’s coefficient (n > 30 cells across three separate experiments). (e and f) Overexpression of eIF6 increases localization of activated ERK1/2 at focal adhesions. (e) Representative immunofluorescent confocal micrographs for ECs transduced with control adenovirus (Ad.LACZ) or an eIF6-expressing adenovirus (Ad.eIF6) showing pERK1/2T202/Y204 (green) and vinculin (red). Scale bars = 20 μm. (f) Colocalization of pERK1/2T202/Y204 to vinculin was quantified using Pearson’s coefficient (n > 30 cells across three separate experiments). (g–j) Mechanocomplex formation is force and eIF6 dependent. ECs transfected with si Scr or si eIF6 were subjected to force on PECAM-1 for 0 min (no force [NF]) or 30 min (force [F]). Colocalization of FAK with actin (g), pERKT202/Y204 with actin (h), RACK1 with α-actinin (i), and pERKT202/Y204 with α-actinin (j), using Pearson’s coefficient, following force (n > 30 cells across three separate experiments). Values in d–j are mean ± SEM, and significance in d and f was determined by two-sided t test and in g–j by two-way ANOVA. *, P < 0.05; **, P < 0.01; ***, P < 0.001; ****, P < 0.0001.

