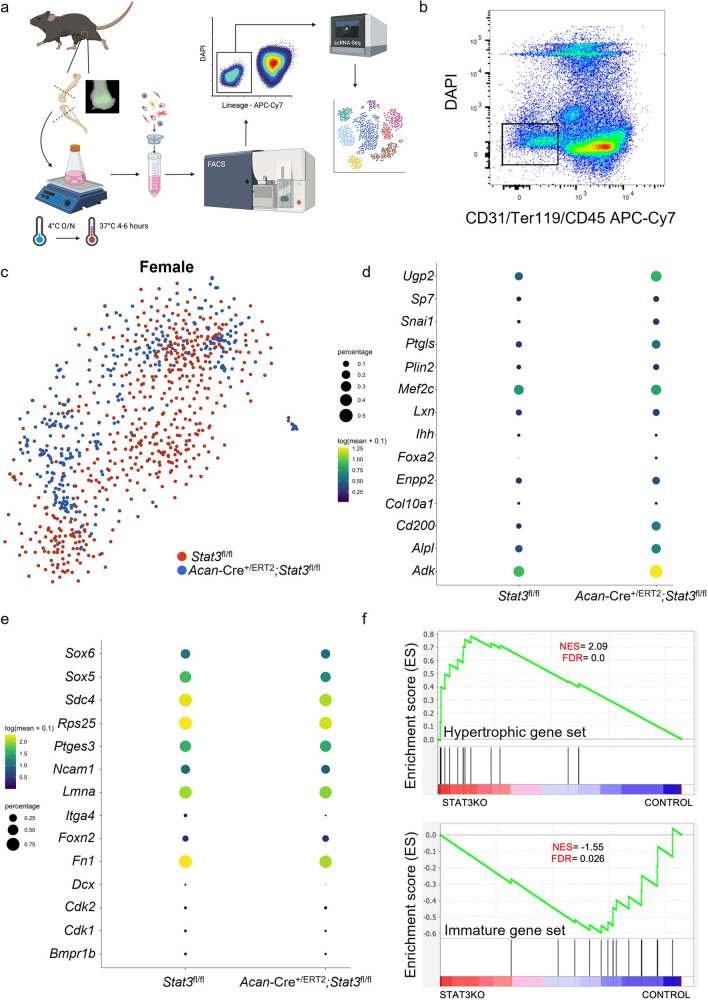
Fig. 6. scRNA-sequencng reveals loss of Stat3 in growth plate chondrocytes promotes premature differentiation.
a Schematic of isolation, sorting and single-cell sequencing of chondrocytes from 1 month mouse knee joints. Epifluorescent analysis of Sox9-GFP femurs confirmed the dissection strategy. b Live cells negative for markers of endothelium (CD31), red blood cells (Ter119) and white blood cells (CD45) were sorted (black box) from dissociated knee joints pooled from 2–3 female control Stat3fl/fl or Acan-Cre+/Cre;Stat3fl/fl mice and subjected to scRNA-sequencing. c tSNE plot of single cells selected for expression of Sox9 and Col2a1 and colored by genotype of origin. Expression pattern of genes associated with growth plate chondrocyte maturation (d) as well as immature, proliferating chondrocytes (e) are shown. f Gene set enrichment analysis (GSEA) plots for chondrogenic maturation (top) and immature, proliferative chondrogenic (bottom) gene sets in Stat3fl/fl (control) and Acan-Cre+/Cre;Stat3fl/fl (Stat3KO) female mice. The “barcode graph” (lower portion) of each plot shows the target genes rank-ordered (left to right) by their differential expression in Stat3KO mice as compared to control mice (indicated by Enrichment Score on the y-axis). Signal-to-noise ratio metric was used for ranking of gene expression patterns in cells. NES normalized enrichment score, FDR false discovery rate.

