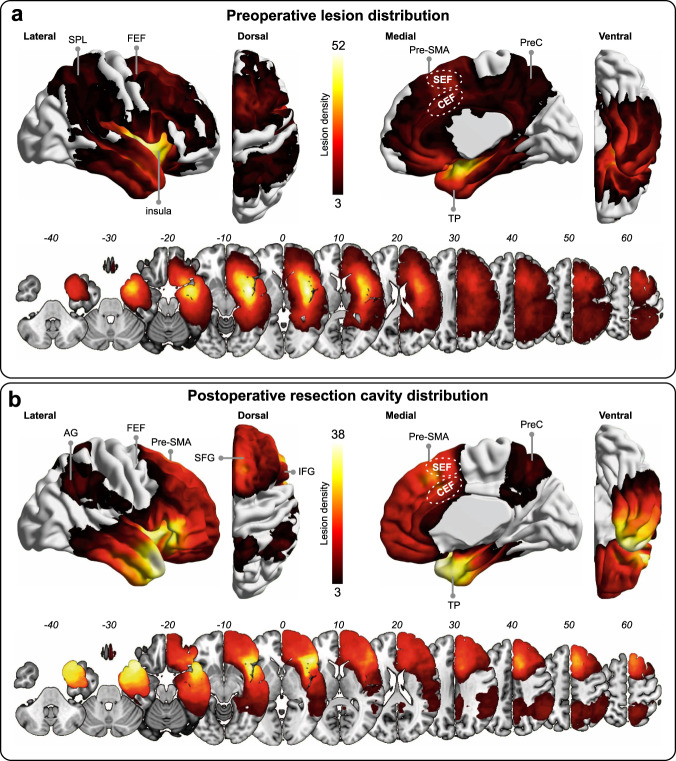
Fig. 1. Lesion overlap maps.
Density overlap map of a preoperative tumors and b surgical cavities for the 128 patients included in this study. These maps are thresholded in such a way that only voxels affected in at least three patients (the threshold for SVR-LSM analyses; see “Methods” section) are shown. Bars indicate lesion density. The maximum overlap was in the insula for both the tumor map (n = 52) and the resection cavity map (n = 38). The relative position of the supplementary eye field (SEF) and the cingulate eye field (CEF) is shown. For indicative purposes, both areas were more or less infiltrated in 16 patients before surgery and furthermore or less resected in 18 patients. AG angular gyrus, FEF frontal eye field, IFG inferior frontal gyrus, PreC precuneus, Pre-SMA pre-supplementary motor area, SFG superior frontal gyrus, TP temporal pole.

