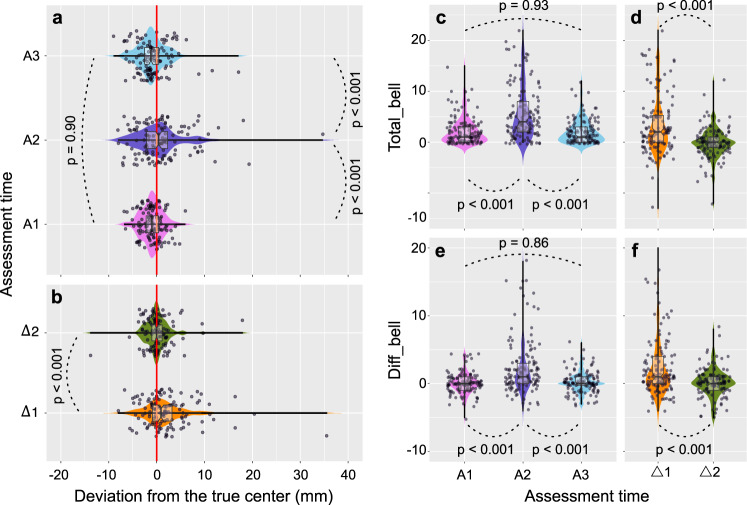
Fig. 2. Combined violin and notch boxplots of behavioral measurements.
a The three assessments for the line bisection task (n = 128 for each measure). b Delta measures for the line bisection task (n = 128 for each measure). c The three assessments for total_bell (n = 128 for each measure). d Delta measures for total_bell (n = 128 for each measure). e The three assessments for diff_bell (n = 128 for each measure). f Delta measures for diff_bell (n = 128 for each measure). For each notch boxplot, the horizontal line at the center indicates the median value, the lower and upper bounds of the box indicate 25–75% interquartile range and whiskers indicate 1.5× interquartile range; individual scores are shown separately as dots. Repeated measures ANOVAs (two-sided) were used to assess statistical significance. When significant, pairwise multiple comparisons analyses were conducted with the Scheffé test which controls for the familywise error rate. Statistical analyses are fully detailed in the main text. R software (https://www.R-project.org/; packages = ggplot2 & ggpubr) was used to create this figure. Source data are provided as a Source Data file.

