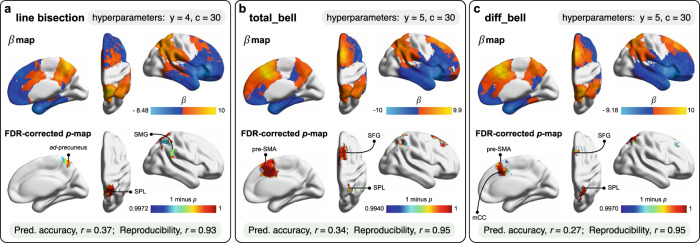
Fig. 3. SVR-LSM results.
a line bisection estimates. b total_bell. c diff_bell the raw β-map is placed at the top, whereas the FDR-corrected (at q = 0.05) (1-p)-map is underneath. The used hyper-parameters are displayed at the top. The prediction accuracy and reproducibility of the SVR-LSM models are indicated at the bottom. ad antero-dorsal, GSM supramarginal gyrus, pre-SMA pre-supplementary motor area, SFG superior frontal gyrus, SPL superior parietal lobule. Note that 1-p-values are used to facilitate visualization. See Table 1 for a detailed report of significant areas.

