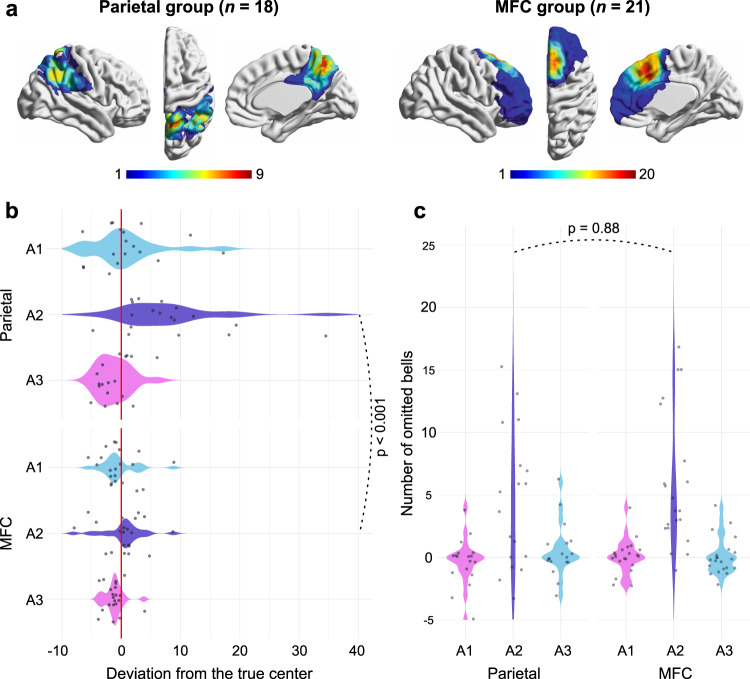
Fig. 4. Results from group analyses.
a Overlap maps for each group or patients. Bars indicate lesion density at each voxel. b Violin plot for line bisection performance. c Violin plot for diff_bell. Individual scores are shown separately as dots. Two mixed ANOVAs (two-sided) were conducted to assess statistical significance, with the time of assessment {A1, A2, A3} as a within-subject factor and patient group as a between-group factor {parietal, MFC}. When significant, pairwise multiple comparisons analyses were conducted with the Scheffé test which controls for the familywise error rate. Statistical analyses are fully detailed in the main text. Source data are provided as a Source Data file.

