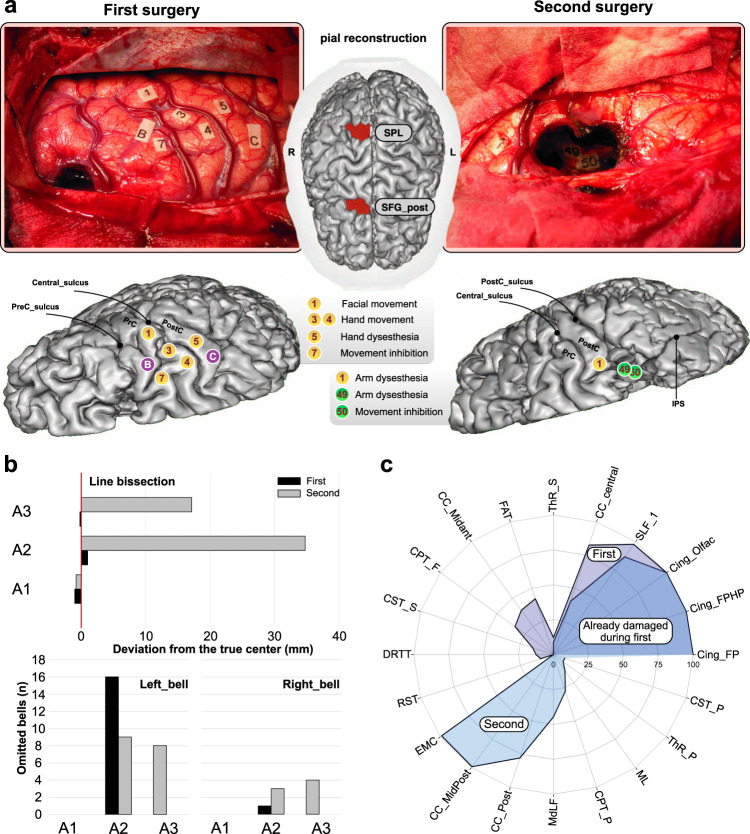
Fig. 6. Anatomical, neurosurgical, and behavioral data of the patient analyzed in isolation (case study).
a Intrasurgical photos and pial reconstruction of the brain (performed on the 3-month postoperative MRI). Labeled numbers correspond to functional sites unmasked during electrostimulation mapping, while labeled letters correspond to spatial delineation of the tumor obtained with ultrasonography. The red color on the central pial mesh indicates the spatial location of the two successive resections. b Behavioral data at each time point and for each surgery. c Radar plot indicating the estimated percentage of damage within each tract for each surgery. CC corpus callous, Cing cingulum, CPT cortico-pontine tract, CST cortico-striatal tract, DRTT dentatorubrothalamic tract, EMC extreme capsule, FAT frontal asltant tract, MdLF middle longitudinal fasciculus, ML medial lemniscus, PrC precentral gyrus, PostC postcentral gyrus, RST reticulospinal tract, SFG superior frontal gyrus, SLF superior longitudinal fasciculus, SPL superior parietal lobule, ThR thalamic radiations. See Supplementary Fig. 6 for slices from the patient’ native anatomical MRI. Source data are provided as a Source Data file.

