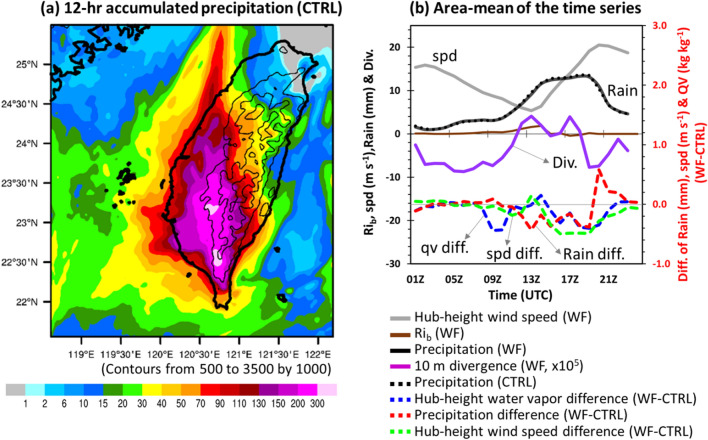
Figure 4.
(a) 12-h accumulated precipitation (mm) in case CTRL over Taiwan during 12:00–23:00 UTC on July 30, 2017. Contours indicate the terrain height (m). (b) Area-mean (22.5–24° N, 119.5–121° E) of the time series of hub-height wind speed in case 356-WTs (denoted by the grey line, m s−1), 10-m divergence (purple line, s−1, left axis) and atmospheric stability (brown line, left axis) calculated from model levels 1 (~ 17 m) and 6 (~ 198 m) close to the rotor disk (28–192 m) in case 356-WTs (23.9–24.2° N, 120.0–120.1° E), and precipitation (black solid line, mm, left axis) of case 356-WTs and CTRL (black dashed line, mm, left axis), and the differences of precipitation (red dashed line, mm, right axis), hub-height wind speed (green dashed line, m s−1, right axis) and hub-height water vapor (blue dashed line, g kg−1, right axis) during 01:00–23:00 UTC on July 30, 2017. Maps and plots were produced using NCAR Command Language (NCL) version 6.6.237.

