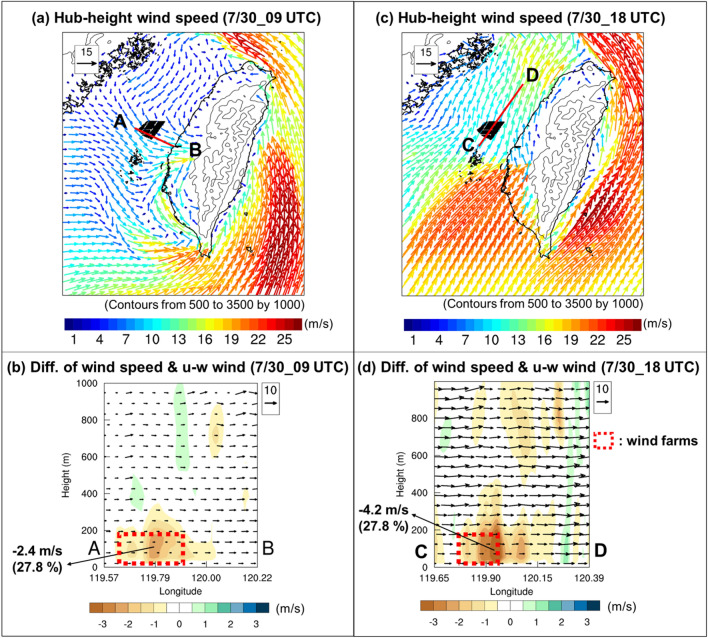
Figure 5.
Vertical cross-sectional diagram of simulation (D02: resolution is 2 km) differences between case 356-WTs and CTRL along the line AB (CD) at 09:00 (18:00) UTC on July 30, 2017: (a) horizontal hub-height wind speed in case 356-WTs (vector, m s−1) at 09:00 UTC, (b) horizontal wind speed difference (shaded, m s−1) and u-w wind vectors in case 356-WTs (w-wind: × 102, m s−1) at 09:00 UTC, (c) horizontal hub-height wind speed in case 356-WTs (vector, m s−1) at 18:00 UTC, (d) horizontal wind speed difference (shaded, m s−1) and u-w wind vectors in case 356-WTs (w-wind: × 102, m s−1) at 18:00 UTC. Maps and plots were produced using NCAR Command Language (NCL) version 6.6.237.

