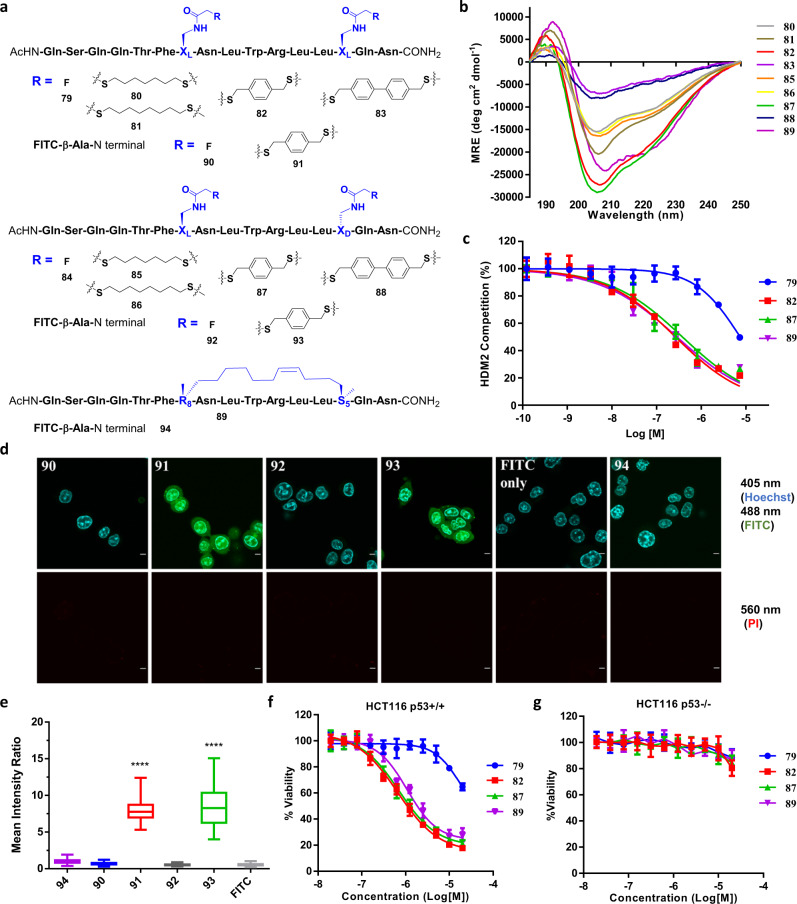
Fig. 8. FTDR-stapled p53 peptide analogues.
a FTDR coupling between unprotected p53 peptide analogues (79, 84) and various dithiol linkers with i, i + 7 linkage. The reported p53 peptide analogue 89 was prepared based on RCM stapling. Coupling residues XL/XD/R8/S5 are highlighted in blue. Peptides 90–94 are the N-terminal FITC labelled versions of peptide 79, 82, 84, 87, and 89. b CD spectra of all crosslinked p53 peptide analogues. c ELISA assay of stapled p53 peptide analogues (82, 87, RCM control 89) and the unstapled control 79 for their inhibition of p53-HDM2 interaction. Data represents mean values ± SD (n = 3 independent samples). d Fluorescent confocal microscopy images of the wild type HCT116 cells treated with the N-terminal FITC labelled peptides 90–94 and FITC as a negative control. Blue (405 nm channel): nucleus stained by Hoechst 33342; Green (488 nm channel): FITC; Red (560 nm channel): propidium iodide staining; Scale bar: 5 μm. e Quantification analysis of the cell penetration of peptides 90–94 (n = 159 for 94, n = 144 for 90, n = 163 for 91, n = 134 for 92, n = 155 for 93, n = 148 for FITC only). The mean intracellular intensity of the RCM-stapled peptide 94 was normalized as 1. Box plots show 25–75% quantiles, median values (bullseye), and minimal and maximal values (whiskers). Two-sided unpaired t test with Welch’s correction has been applied. “****” Represents p < 0.0001. f–g Cell viability assays in p53 wild-type HCT-116 cells (f) and p53 null HCT-116 cells (g) treated with well-stapled p53 peptide analogues. Data plots are mean values ± SD based on n = 3 independent samples.

