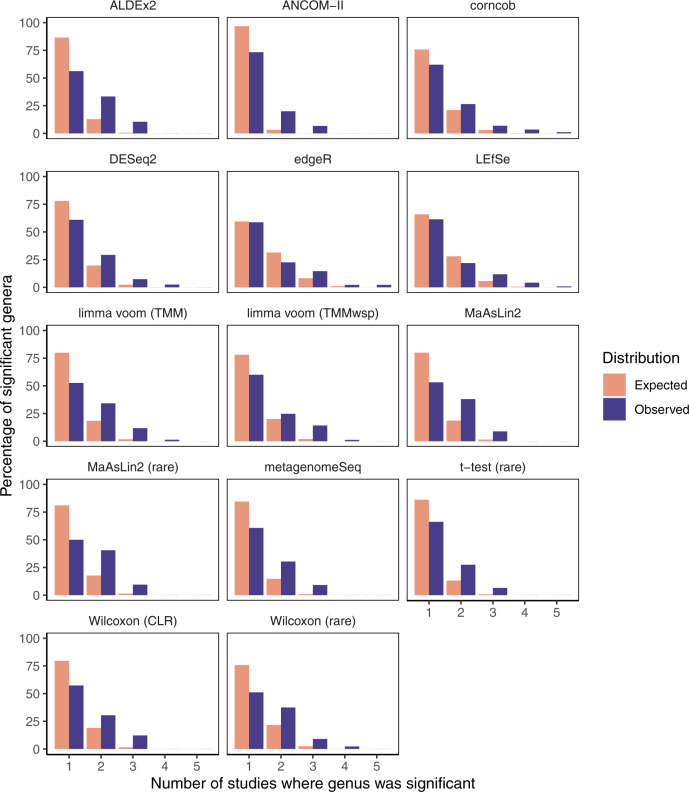
Fig. 5. Observed consistency of significant genera across diarrhea datasets is higher than the random expectation overall.
These barplots illustrate the distributions of the number of studies for which each genus was identified as significant (excluding genera never found to be significant). The random expectation distribution is based on replicates of randomly selecting genera as significant and then computing the consistency across studies. Abbreviations: TMM, trimmed mean of M-values; TMMwsp, trimmed mean of M-values with singleton pairing; rare, rarefied; CLR, center-log-ratio. Source data are provided as a Source Data file.

