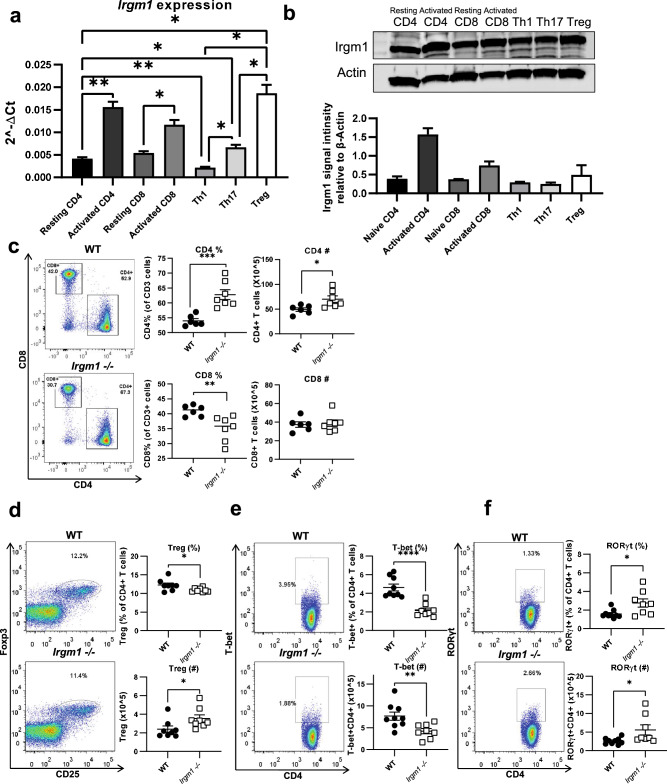
Figure 1.
Irgm1 is expressed in T cell populations and its deficiency is associated with changes in T cell proportions. CD4+ and CD8+ T cells were isolated from spleens of C57BL/6 mice and analyzed at rest or activated with plate bound antibodies to CD3 and CD28. CD4+ T cells were further differentiated into Th1, Th17, and Treg cell populations, as detailed in the Methods. (a) T cell RNA was generated and Irgm1 gene expression was analyzed by qRT-PCR. (Welch's ANOVA test p = 0.0002, multiple unpaired t with Welch's correction used to compare pairs) (b) T cell lysates were generated and immunoblotted for Irgm1 protein expression relative to actin (Kruskal–Wallis test p = 0.065, Dunn's multiple comparisons used to compare pairs). (c-f) Splenocytes were isolated from WT and Irgm1−/− mice, stained and analyzed by flow cytometry for CD4 and CD8 (c), CD4+Foxp3+ (Treg) (d), CD4+T-bet+ (Th1) (e) and CD4+RORγt+ (Th17) (f). Each dot represents a single mouse. (a-c) data are representative of two independent experiments (d-f) data are pooled from 2–3 independent experiments (n = 8–9); error bars represent ± SEM. Mann Whitney test or T-test with Welch’s correction was used to compare groups depending on the normality of the distribution as judged by the Shapiro–Wilk test.. *p < 0.05, **p < 0.01, ***p < 0.001, ****p < 0.0001.

