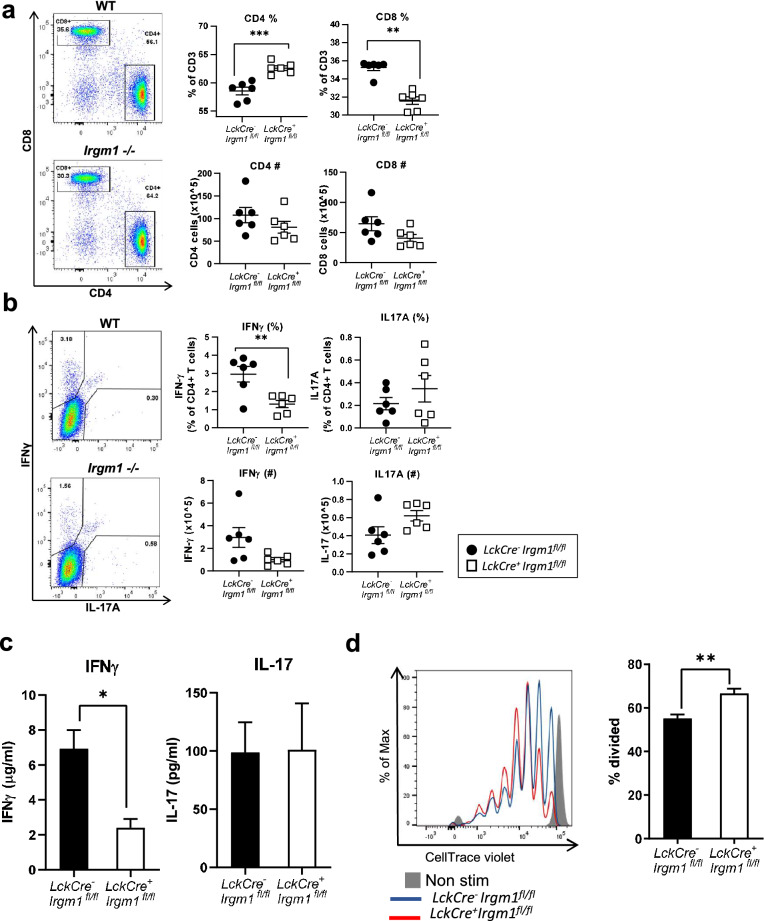
Figure 4.
Changes in Th1 and Treg cell populations and function are largely due to intrinsic loss of Irgm1 expression. (a-b) Splenocytes were isolated from LckCre+Irgm1fl/fl cKO mice and LckCre−Irgm1fl/fl littermate controls, stained and analyzed by flow cytometry for CD4 and CD8 cells (a), CD4+IFNγ+ and CD4+IL-17+ (b). (c) CD4+ T cells were isolated and activated for 48 h with plate bound anti-CD3 and anti-CD28 antibodies, after which the media was collected and IFNγ and IL-17A were measured by ELISA. (d) In vitro differentiated Treg cells from LckCre+Irgm1fl/fl cKO mice and LckCre−Irgm1fl/fl littermate controls were co-cultured for three days with WT CD8+ T cells stained with CellTrace violet. Treg suppressive capacity was analyzed by the ability to reduce proliferation of CD8+ T cells, as measured by dilution of fluorescent dye flow cytometrically (The CD8:Treg ratio for the data shown is 2:1). (a, b) data pooled from two independent experiments (n = 6), (c, d) data representative of two independent experiments (n = 3–6); error bars represent ± SEM. Mann Whitney test or T-test with Welch’s correction was used to compare groups depending on the normality of the distribution as judged by the Shapiro–Wilk test.*p < 0.05, **p < 0.01, ***p < 0.001.

