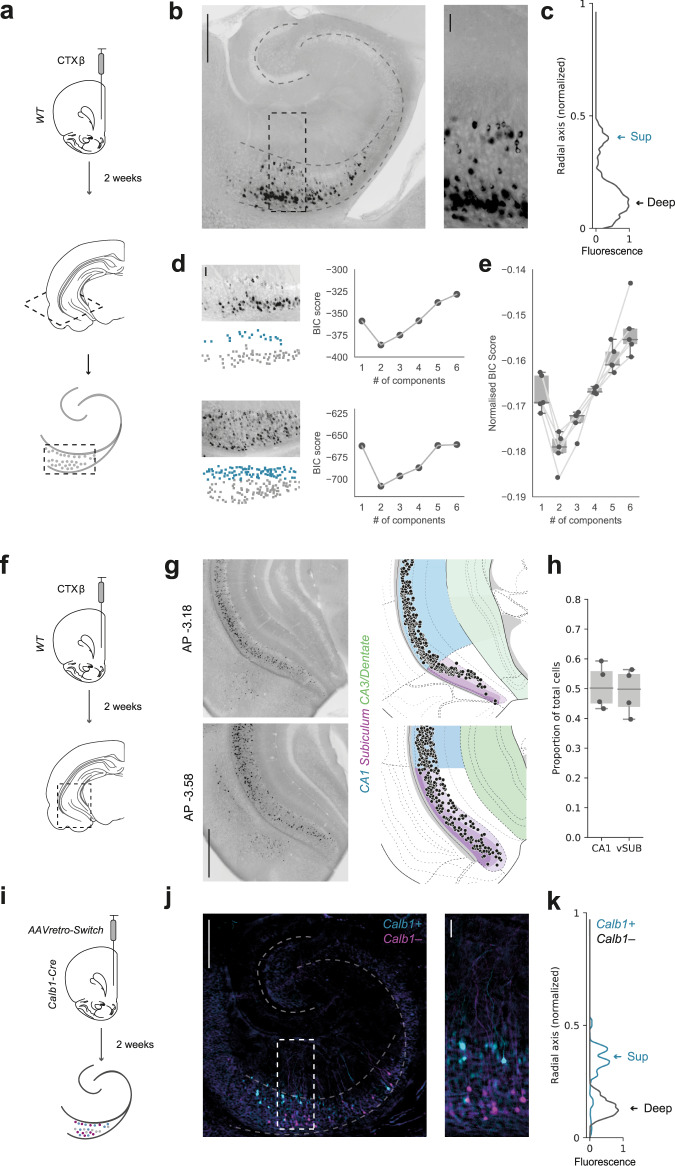
Fig. 1. Hippocampal neurons projecting to PFC form two populations segregated across the radial axis.
a Schematic of cholera toxin (CTXβ) injection into PFC and retrograde labelling in transverse hippocampal slices. b Left, Transverse slice of hippocampus labelled with CTXβ. Right, zoom of retrogradely labelled neurons in boxed region. Scale bars = 500 µm (Left) 100 µm (Right). Image representative of slices from 5 injections. c Normalised fluorescence intensity profile of labelled cells in example slice in (b). Arrows highlight the two distinct peaks of fluorescence at the two extremes of the radial axis. d Two sample hippocampal transverse sections labelled with CTXβ (left, top panels) and the color-coded cells within the sections clustered using a GMM (left, bottom panels). Right, BIC scores for GMM clustering of cells using a range of 1–6 components. Note that for both examples, 2 components produce the lowest score. Scale bar = 100 µm. e Summary of BIC scores produced after clustering hippocampal slices from all injections investigated. Note that 2 components consistently showed the lowest BIC score. n = 5 injections. f Schematic of CTXβ injection into PFC and retrograde labelling in coronal hippocampal slices. g Left, Examples of CTXβ labelling in coronal hippocampal slices at AP level –3.18 and –3.58. Right, vH-PFC neurons aligned to the HGEA atlas. Scale bar = 1 mm. h Quantification of vH-PFC neurons in CA1 and subiculum. n = 4 injections. i AAVretro-Switch injection into the PFC of Calb1-IRES-Cre mice and subsequent cre-dependent retrograde labelling in hippocampus. j Transverse slice of hippocampus labelled with AAVretro-Switch. Cyan labels Calb1+ PFC-projecting neurons and magenta labels Calb1– neurons. Right, zoom of retrogradely labelled neurons in boxed region. Scale bar = 500 µm (Left) 100 µm (Right). Image representative of slices from 4 injections. k Normalised fluorescence intensity profile for Calb1+ (cyan) and Calb1– (black) neurons. Arrows highlight the two genetically distinct peaks of fluorescence at the two extremes of the radial axis. Box plots show median, 75th (box) and 95th (whiskers) percentile.

