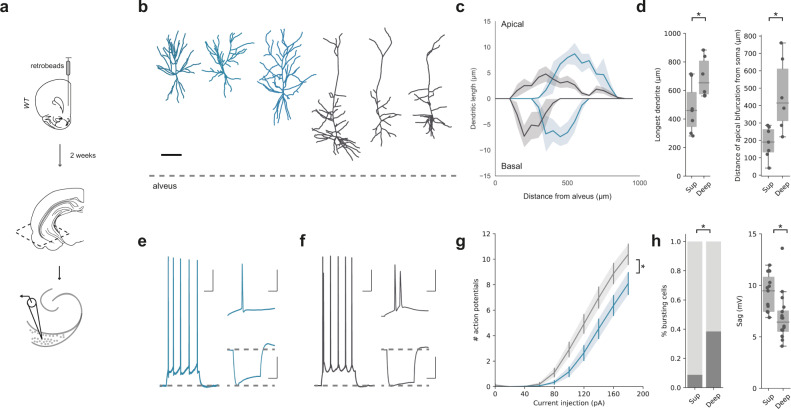
Fig. 2. Superficial and deep vH-PFC neurons have distinct electrophysiological and morphological properties.
a Schematic of fluorescent bead (retrobeads) injection into PFC and retrograde labelling in transverse hippocampal slices prepared for recordings. b Example reconstructions of superficial (blue) and deep (dark grey) PFC-projecting hippocampal neurons. Scale bar = 100 µm, dotted line represents alveus. Images representative of 7 superficial and 6 deep neurons. c Sholl analysis showing average dendritic length of apical (top) and basal (bottom) dendrites with increasing distance from the alveus (lateral) for superficial (blue) and deep (grey) layer vH-PFC neurons. Note that each population samples a distinct range of the radial hippocampal axis. (Apical: repeated measures ANOVA, Main effect of group: F(35,385) = 1.549, p = 0.027; basal: repeated measures ANOVA with Greenhouse-Geisser correction, Main effect of group: F(33,367) = 1.701, p = 0.179; n = 7 (superficial), n = 6 (deep) neurons from 6 mice). d Left, quantification of the distance from the farthest dendrite tip to the soma (two-sided Mann Whitney, U = 35.5, *p = 0.045). Right, quantification of the distance of the apical bifurcation from the soma in superficial (Sup) and Deep neurons (two-sided Mann Whitney, U = 38.5, *p = 0.015, n = 7 (superficial), n = 6 (deep) neurons from 6 mice). e Left, example response of a superficial layer PFC-projecting cell in response to a current injection of 140 pA. Top right, detail of first 50 ms of current injection. Bottom right, response to a current injection of –160 pA. Scale bars = 100 ms, 20 mV; 10 ms, 20 mV; 100 ms, 20 mV. f As in (e) but for a neighboring deep layer PFC-projecting neuron. Note burst firing in response to current injection, and lower level of voltage sag after negative current injection. g Quantification of number of action potentials elicited by somatic current injection in superficial (blue) and deep (black) neurons (Repeated measures ANOVA with Greenhouse-Geisser correction, Interaction between group and current step: F(1.4, 44.5) = 4.3, *p = 0.032, n = 22 (sup) and 26 (deep) from 12 mice). h Left, quantification of the proportion of bursting neurons after positive current injections (Fishers Exact test, Odds ratio = 12.5, *p = 0.009). Right, quantification of sag amplitude after negative (–160 pA) current injections (two-sided Mann Whitney, U = 39.5, *p = 0.002, n = 22 (sup) and 26 (deep) from 12 mice). Box plots show median, 75th (box) and 95th (whiskers) percentile. Line plots show mean (line) and SEM (shading and error bars).

