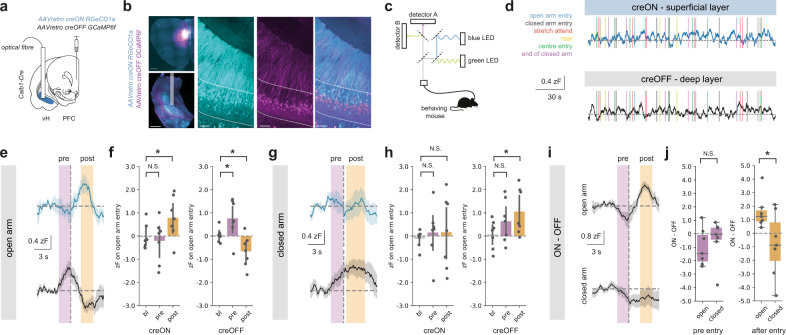
Fig. 5. Superficial and deep vH-PFC neuron activity differs during arm entry in the EPM.
a Strategy to record superficial and deep vH-PFC neuron calcium dynamics during free behaviour. b Left, example images of the viral strategy implemented for imaging. Left, injection of retrograde calcium sensors in PFC (top) and photometry fibre implant in vH (bottom). Scale bars = 500 µm. Right, zoom of creON RGeCO1a (cyan) and creOFF GCaMP6f (magenta) calcium sensor expression in the superficial and deep layers of vH, respectively. Scale bars = 100 µm. Images representative of slices from 7 mice. c Light path and recording setup for dual signal detection during free behaviour, allowing simultaneous detection of superficial and deep layer activity, see also Supplementary Fig.9. d Example traces of creON (superficial layer) and creOFF (deep layer) calcium signal while a mouse is behaving during EPM exploration. e Summary traces of superficial (top, blue) and deep (bottom, grey) layer activity aligned to open arm entry (dashed line) during EPM exploration. Activity periods pre (magenta) and post (orange) arm entry are highlighted for subsequent quantification. f Summary of peri-event normalized calcium-dependent fluorescence recorded from superficial layer (creON) and deep layer (creOFF) cells during the baseline (bl; –6 s to –5 s before arm entry), pre and post arm entry periods for open arm entries. Superficial (creON) neurons increase activity on open arm entry (Repeated measures ANOVA, Main effect of epoch: F(2,12) = 4.52, *p = 0.034; planned two-sided Welch’s paired t-test with Holm-Šidák correction: bl vs. pre: t(6) = 0.3, N.S.p = 0.77; bl vs post: t(6) = 4.4, *p = 0.004, n = 7 mice), while deep (creON) neurons increase pre-entry and decrease activity post-entry (Repeated measures ANOVA, Main effect of epoch: F(2,12) = 13.4, *p = 0.001; planned two-sided Welch’s paired t test with Holm-Šidák correction: bl vs. pre: t(6) = 2.5, *p = 0.04; bl vs post: t(6) = 3.4, p = 0.02, n = 7 mice). See supplementary statistics table for further information. g As in (e) but for closed arm entry. h As in (f) but for closed arm entry. In contrast to open arm entries, superficial layer activity remains unchanged (Repeated measures ANOVA, Main effect of epoch: F(2,12) = 0.11, N.S.p = 0.90; planned two-sided Welch’s paired t test with Holm-Šidák correction: bl vs. pre: t(6) = 0.8, N.S.p = 0.43; bl vs post: t(6) = 0.06, N.S.p = 0.95, n = 7 mice), while deep layer neurons show a sustained increase in activity around and upon closed arm entry. i As in (e) and (g) but for the difference between simultaneously recorded superficial (ON) and deep (OFF) layer activity. j Summary showing the difference between superficial (ON) and deep (OFF) activity pre- (magenta, left) and post- (orange, right) entry into the open and closed arms. Values above 0 indicate a bias towards superficial layer activity and values below 0 indicate a bias towards deep layer activity. Note that while activity pre-entry into both open and closed arms does not show a layer bias (two-sided Welch’s paired t test with Holm-Šidák correction, t(6) = 0.6, N.S.p = 0.59), activity post-entry is biased towards the superficial layer for open arm and towards deep layer cells for closed arm entries (two-sided Welch’s paired t test with Holm-Šidák correction, t(6) = 3.1, *p = 0.02, n = 7 mice). Box plots show median, 75th (box) and 95th (whiskers) percentile. Line plots show mean (line) and SEM (shading and error bars), bar charts show mean (bar) and SEM (error).

