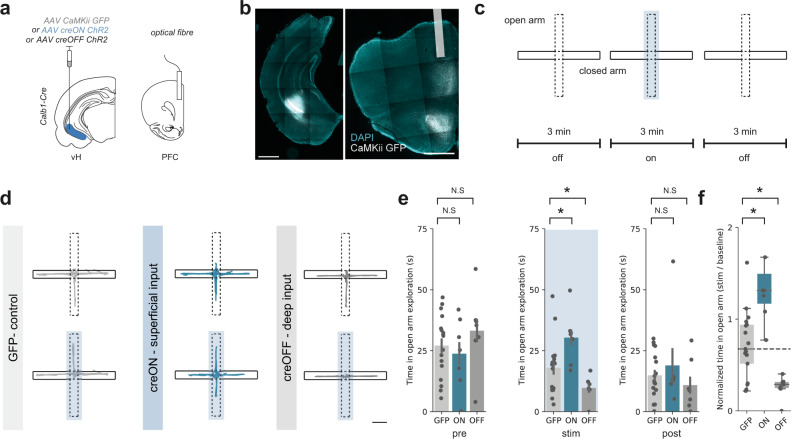
Fig. 6. Superficial and deep vH-PFC populations bidirectionally influence behaviour in the EPM.
a Strategy for in vivo optogenetic manipulation of vH axons from each layer in PFC. b Example images of viral injection into vH (left) and optic fibre implant in PFC (right). Scale bars = 1000 µm. Image representative of slices from all mice used in optogenetic experiments below. c Schematic showing experimental design. d Trajectories of an example mouse during baseline (top) and during stimulation (bottom) for GFP (left), creON (centre) and creOFF (right) experiments. Scale bar = 10 cm. e Summary showing time spent in open arm exploration during the first 3 min epoch of no stimulation (left), the central 3 min with light stimulation (blue box, middle) and the final epoch of no light stimulation (right). Note that differences in time spent in open arm exploration are only evident during the central epoch coupled with light stimulation (Mixed ANOVA, interaction between epoch and group: F(4,56) = 4.78, p = 0.002; planned two-sided Welch’s paired t test: Pre: GFP vs creON, t(10) = 0.5, N.S.p = 0.61; GFP vs creOFF, t(9.3) = 0.4, N.S.p = 0.39; Stim: GFP vs creON, t(11.9) = 2.5, *p = 0.03; GFP vs creOFF, t(21.7) = 2.4, *p = 0.04; Post: GFP vs creON, t(7.3) = 0.5, N.S.p = 0.61; GFP vs creOFF, t(10.2) = 0.9, N.S.p = 0.40, n = 17 (GFP), 7 (creON), 7 (creOFF) mice). See supplementary statistics table for further information. f Summary of the effect of light-evoked activation on open arm exploration. Superficial layer (creON) stimulation increased, while deep layer (creOFF) decreased exploration relative to controls (GFP) (two-sided Mann Whitney, GFP vs creON: U = 12, *p = 0.002; GFP vs creOFF: U = 100, *p = 0.008, n = 17 (GFP), 7 (creON), 7 (creOFF) mice). Dotted line shows median exploration of GFP controls for comparison. Box plots show median, 75th (box) and 95th (whiskers) percentile. Bar charts show mean (bar) and SEM (error).

