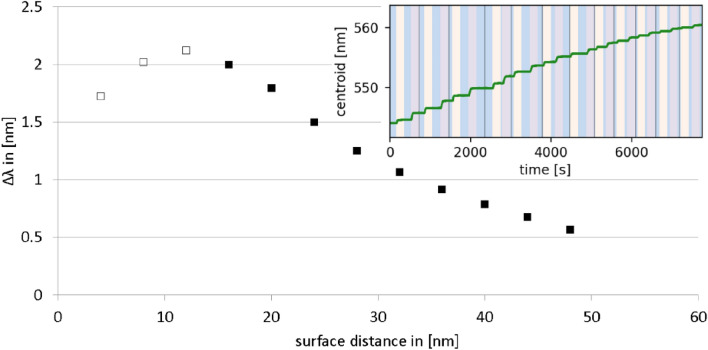
Figure 2.
PAH/PSS bilayers realized by layer-by-layer (LbL) deposition. Plasmon shift (Δλ) in nm for each bilayer plotted against the number of PAH/PSS bilayer deposited on 80 nm spherical gold nano-particle sensors. The first two to three bilayers layers (unfilled squares) are known to be improperly formed34. Inset: Original sensogram plotting the LSPR response (peak wavelength) against time. Blue = 0.1 M NaCl, ivory = 1 mM PAH and purple = 1 mM PSS.

