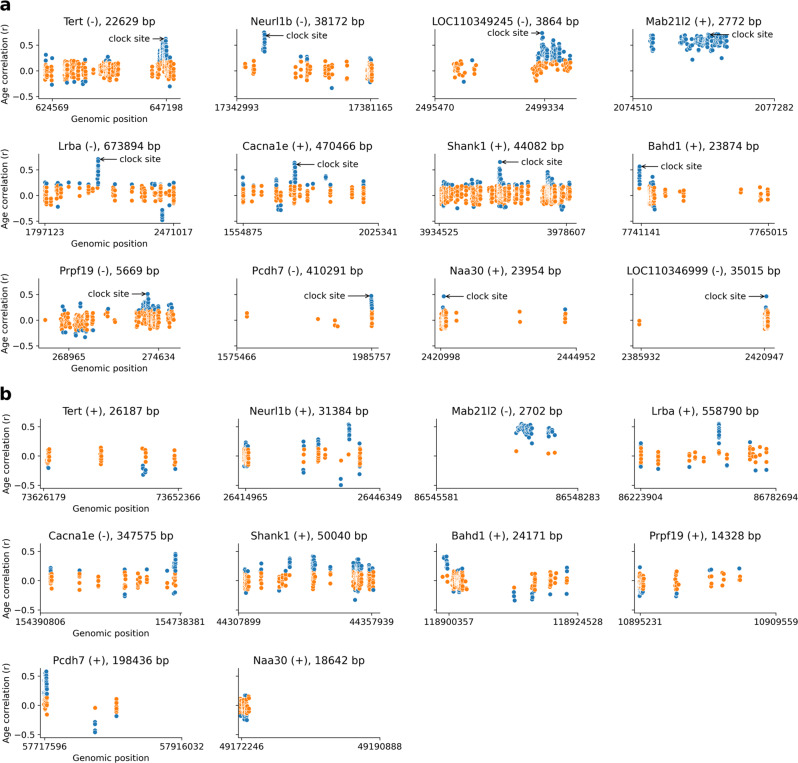
Fig. 3. Patterns of age-related DNA methylation changes of NMR clock-associated genes.
a Correlation coefficient with age (y-axis) for all covered CpG sites within an NMR clock-associated gene along its 1,500 bp long upstream or downstream flanking region including the promoter region (upstream). Gene name, strand and the length of the transcript are shown on the top. The start and end positions of genes are indicated on the x-axis. Transcription start site (TSS) shown in the right for the negative strand (-) genes and in the left for the positive strand (+) genes. Arrows point to the highest age-correlated clock CpG site for each gene. b Age-associated methylation patterns of mouse homologs of the NMR clock-associated genes for comparison. Significant correlations (p < 0.05) were colored blue. We calculated two-sided p-values without an adjustment for multiple comparison.

