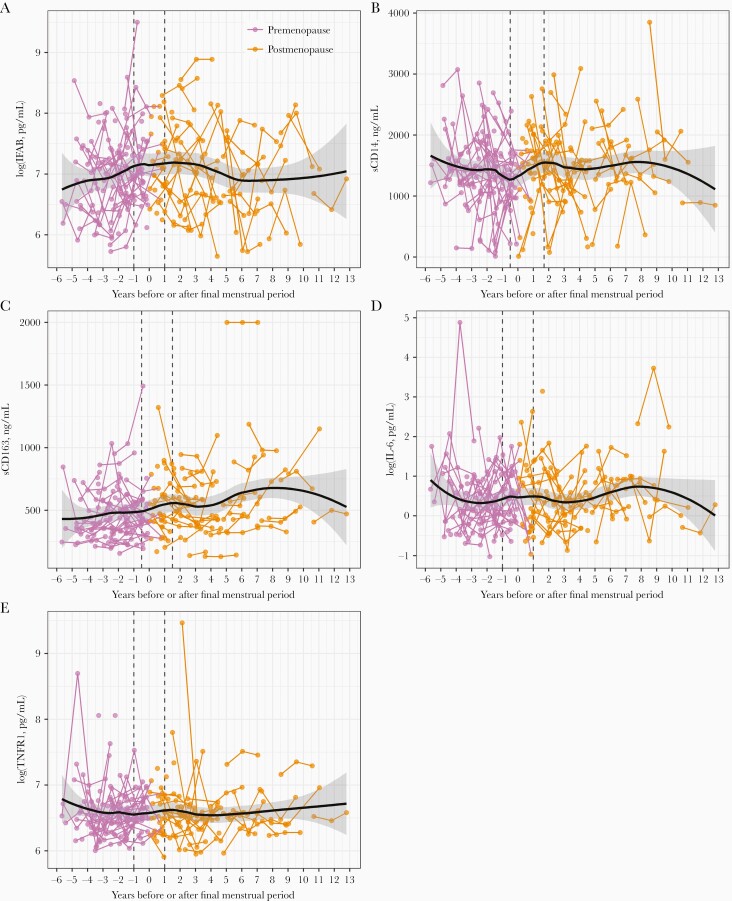
Figure 1.
Scatter plots of gut barrier dysfunction, innate immune activation, and inflammation biomarkers over years before/after the final menstrual period. In scatter plots of (A) log(IFAB), (B) sCD14, (C) sCD163, (D) log(IL-6), and (E) log(TNFR1), lines connect points from the same woman, and points/lines are colored according to menopause status. Plots are overlaid with nonparametric locally weighted smoothing curves, shown with black curves and 95% confidence intervals. Inflection points used in piece-wise linear mixed effects models are shown with dashed vertical lines; points were visually chosen for sCD14 and sCD163, while default points of 1 year before and 1 year after the final menstrual period were used for IFAB, IL-6, and TNFR1 due to lack of obvious change in slope around the final menstrual period. Number of unique identities and person-visits, respectively, included in each plot are: IFAB, sCD14, and sCD163, 350, 674; IL-6, 349, 672; and TNFR1, 350, 672. Abbreviations: IFAB, intestinal fatty acid binding protein; IL-6, interleukin 6; sCD14, soluble CD14; sCD163, soluble CD163; TNFR1, tumor necrosis factor receptor 1.

