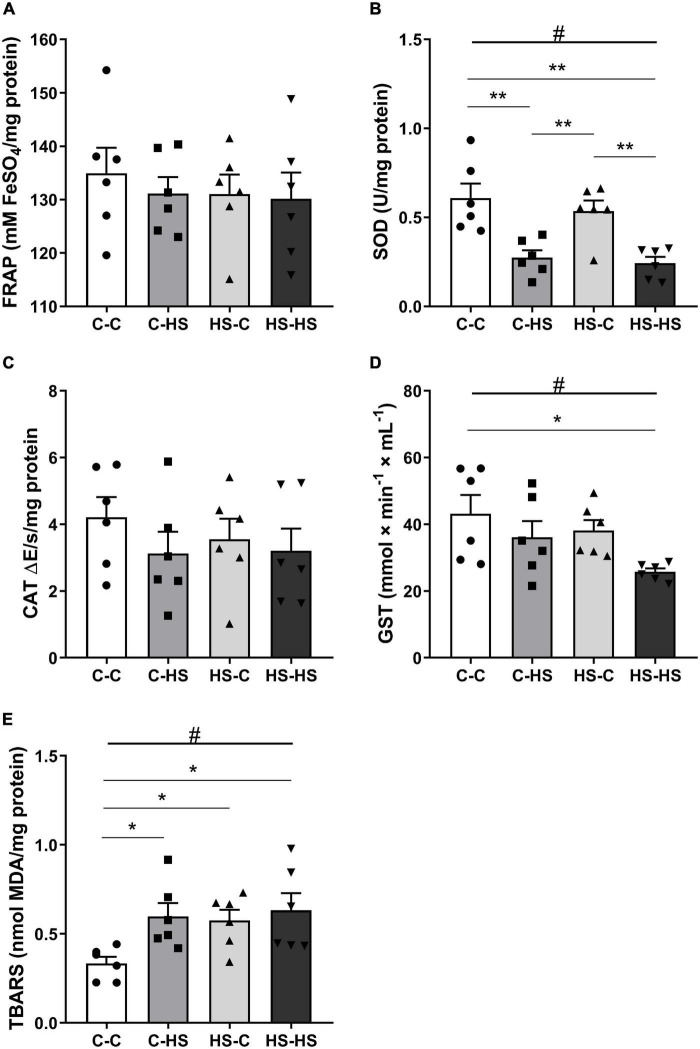
FIGURE 4.
The ferric reducing antioxidant power (FRAP) total antioxidant capacity (A), superoxide dismutase (SOD) (B), catalase (CAT) (C), glutathione S-transferase (GST) activity (D), and the thiobarbituric acid reactive substances (TBARS) (E) concentration in the amygdala. C-C, offspring of standard diet fed dams who received a standard diet after weaning; C-HS, offspring of standard diet fed dams who received a HS diet after weaning; HS-C, offspring of HS diet fed dams who received a standard diet after weaning; and HS-HS, offspring of HS diet fed dams who received a HS diet after weaning. Data are shown as mean and SEM; n = 6. #p < 0.05 (postweaning factor); *p < 0.05, **p < 0.01 (interaction of the pre- and postweaning factors) using the ANOVA and the Newman–Keuls tests.

