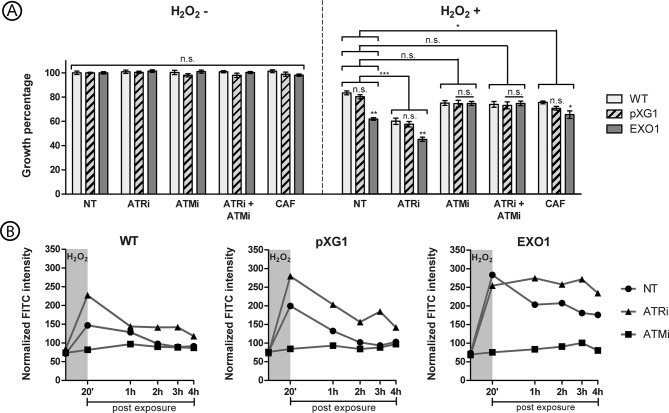
Figure 4.
Effect of ATR and ATM inhibitors in the growth and ssDNA formation of L. major lineages exposed to hydrogen peroxide. (A) The graph display percentage of growth of L. major wild-type (WT, light grey columns), episome vector control (pXG1, hatched columns) and LmjEXO1 overexpressor lineage (EXO1, dark grey columns), after exposure to hydrogen peroxide (H2O2). The parasite cells were treated with 5 mM caffeine (CAF), 10 μM ATRi, 10 μM ATMi, or a combination of 10 μM ATRi and 10 μM ATMi, for 1 hour before the addition of H2O2.The parasites were then exposed to 500 μM H2O2 for 20 minutes. Cells were counted after 72 hours. The growth percentage is relative to the one of parasites not treated and not exposed to H2O2 of each lineage. The data represent mean ± standard error of three independent experiments, each one performed as triplicates. Two way analysis of variance (two-way ANOVA) is shown, and it includes the results of the post-hoc tests of Bonferroni (comparisons between lineages inside each treatment) and Dunnett (brackets comparing treatment groups). Control groups are the parasites not treated with inhibitors. *p < 0,05; **p < 0,005; ***p < 0,0005. (B) The curves exhibit the ssDNA formation kinetics in L. major wild type (WT), episome vector control (pXG1) e LmjEXO1 overexpressor lineage after the exposure to H2O2. Promastigote forms of L. major lineages were incubated during 1 hour in standard culture media (NT, circles) or media containing 10 μM ATRi (triangles) or 10 μM ATMi (squares). 500 μM H2O2 were added to the cultures, which were then incubated for 20 minutes (darker area in the graphs). The parasites were washed for complete removal of the drugs and resuspended in standard culture media. 0,5 a 2×10⁷ cells samples were collected 1 hour after the addition of inhibitors (starting point of the curves), after 20 minutes of the addition of H2O2, and then every hour after the removal of the drugs, until 4 hours post H2O2 exposure. After cell fixation, the parasites were incubated with anti-BrdU FITC conjugate for the detection of 5-IdU nucleotide. The mean fluorescence intensity of parasites with a >102 UA fluorescence intensity was normalized with the mean fluorescence of parasites under that threshold. The histograms used for this quantification are presented in Supplementary Figure 6 . The data are representative of two independent experiments and are presented as means ± standard errors of the normalized fluorescence intensities. n.s., not significant.

