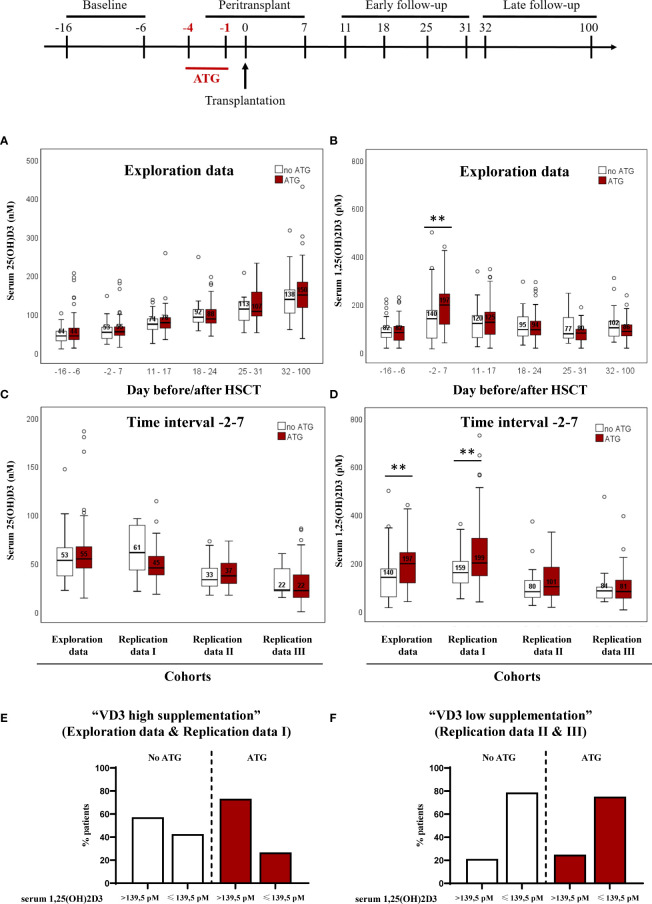
Figure 1.
Impact of ATG treatment on 25(OH)D3 and 1,25(OH)2D3 circulating serum levels of patients undergoing hematopoietic stem cell transplantation Panel (A) depicts the median serum 25-hydroxyvitamin D3 levels followed over time in association with ATG treatment for the discovery cohort. In panel (B), the median serum 1,25(OH)2D3 level is presented. Panel (C) depicts the median serum 25(OH)D3 levels from days -2 to 7 around HSCT of patients receiving ATG and patients that did not received ATG. In panel (D), the median serum 1,25(OH)2D3 level is presented. Numbers indicate median serum 25(OH)D3 and 1,25(OH)2D3 values, error bars indicate 95% confidence interval. Statistical analysis was performed with Mann-Whitney-U test, two-tailed (**p < 0.01). In (E, F) the distribution of patients below and above the calculated cut-off is shown, in relation to ATG treatment for the cohorts with high and low/no vitamin D3 supplementation, respectively.

