
Figure 2.
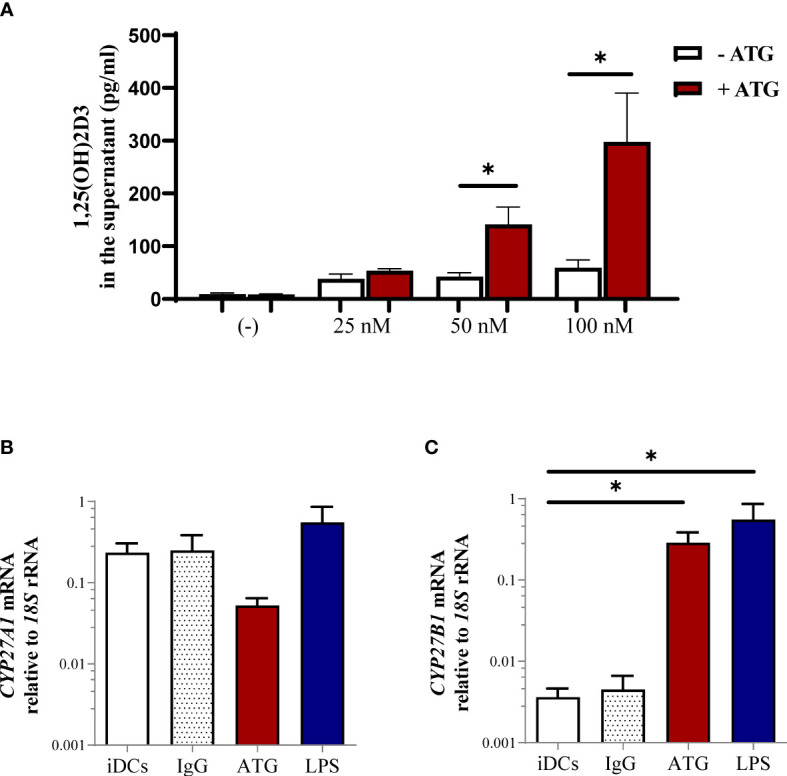
Impact of ATG treatment on production of 1,25(OH)2D3 by human monocyte-derived dendritic cells (DCs). (A) Human monocyte-derived DCs were stimulated for 24 h in the presence of different 25(OH)D3 concentrations in the presence or absence of ATG (100 µg/ml). After 24 h the production of 1,25(OH)2D3 was analyzed by means of chemiluminescence immunoassay. Data are means ± SEM (n≥ 3). Statistical analysis was performed using Mann-Whitney-U test, two-tailed. Panel (B) depicts CYP27A1 and (C) shows CYP27B1 mRNA expression of DCs analyzed by means of quantitative real-time PCR relative to 18S rRNA expression. Data are means ± SEM (n = 4). Statistical analysis was performed using Kruskal-Wallis and Dunn’s posthoc test [*p ≤ 0.05, tested versus immature DC (control)].