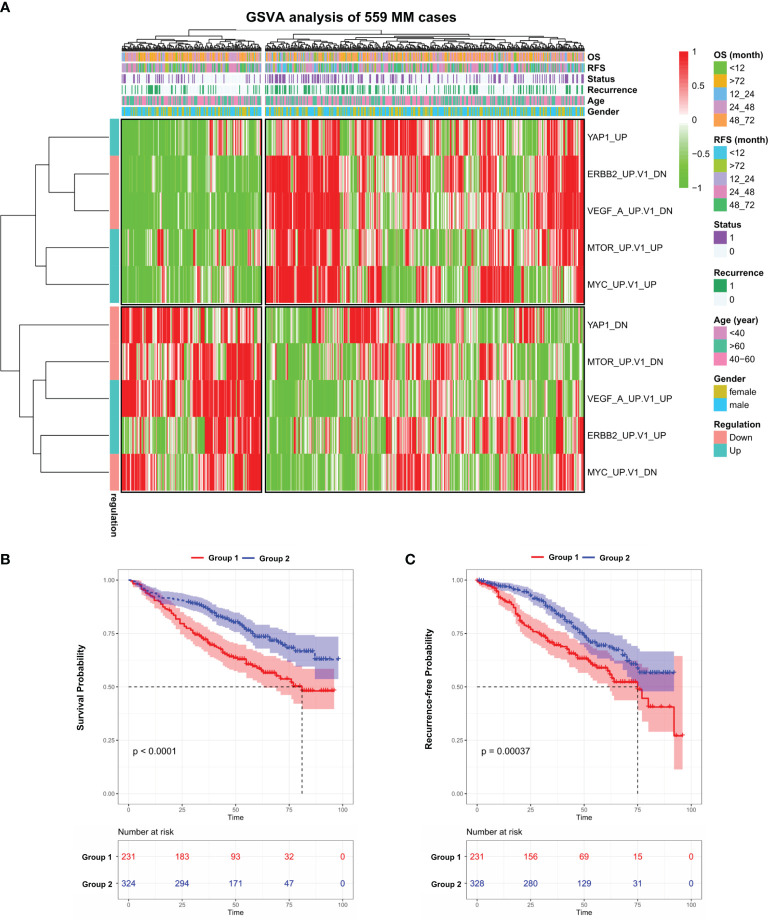
Figure 1.
Gene set variation analysis of 559 newly diagnosed MM cases. (A) Heatmap of gene set variation analysis (GSVA) of 559 Multiple Myeloma transcriptome data (GSE24080) based on 10 selected C6-oncogenic signature gene sets from Molecular Signature Database. The relevant clinical information was added above. (B) Kaplan–Meier survival curves comparing the overall survival in MM group 1 and 2 from the GSE24080 dataset. (C) Kaplan–Meier survival curves comparing the recurrence-free survival in MM group 1 and 2 from the GSE24080 dataset. Results are shown as mean ± CI based on the log-rank t-test.

